- Research
- Open access
- Published:
Forecasting cyberattacks with incomplete, imbalanced, and insignificant data
Cybersecurity volume 1, Article number: 15 (2018)
Abstract
Having the ability to forecast cyberattacks before they happen will unquestionably change the landscape of cyber warfare and cyber crime. This work predicts specific types of attacks on a potential victim network before the actual malicious actions take place. The challenge to forecasting cyberattacks is to extract relevant and reliable signals to treat sporadic and seemingly random acts of adversaries. This paper builds on multi-faceted machine learning solutions and develops an integrated system to transform large volumes of public data to aggregate signals with imputation that are relevant and predictive of cyber incidents. A comprehensive analysis of the individual parts and the integrated whole demonstrates the effectiveness and trade-offs of the proposed approach. Using 16-months of reported cyber incidents by an anonymized victim organization, the integrated approach achieves up to 87%, 90%, and 96% AUC for forecasting endpoint-malware, malicious-destination, and malicious-email attacks, respectively. When assessed month-by-month, the proposed approach shows robustness to perform consistently well, achieving F-Measure between 0.6 and 1.0. The framework also enables an examination of which unconventional signals are meaningful for cyberattack forecasting.
Introduction
The scale and diversity of cyberattacks have changed significantly in recent years, becoming a critical means for monetary gain, intellectual theft, and political agenda worldwide. Recent reports show that the number of cyberattacks continues to rise globally (PwC 2016), and the cost to society due to these attacks is expanding at a tremendous rate (Accenture Security 2017). Forecasting cyberattacks before they take place can offer great value, but is challenging because of the limited relevance one could find from albeit significant volume of ever-changing and diverse ‘unconventional’ signals in social media, news, and other public forums. This paper tackles this challenge by developing an integrated system that treats the problems of incomplete signals, signals with varying significant lags, and imbalanced ground truth labels.
Imagine extracting the level of sentiment towards a target entity, the changes in potential cyber threats, or an increasing amount of activity on social media and global event platforms, and using these signals in an ensemble manner to forecast future cyberattacks. Baumeister et al. (2007) state that rapid and automatic affective responses may inform cognition and behavioral choice and thereby help guide the current behavior of a person. Could social media be used as a crowd-sourced sensor to gain insight for cyberattacks (Khandpur et al. 2017)? These are potential ‘unconventional’ signals that may collectively present sufficient predictive power to forecast cyberattacks. Some recent works (Okutan et al. 2017b; Maimon et al. 2017; Babko-Malaya et al. 2017; Sapienza et al. 2017; Okutan et al. 2018) provide preliminary analysis for the relevance of unconventional signals to forecast cyberattacks. However, extracting these signals from continuously growing big data in a meaningful way requires special treatment (L’Heureux et al. 2017; Al-Jarrah et al. 2015).
A key problem in cyberattack forecasting with unconventional signals is that not all signals produce values on a regular basis since many are event driven. This adds onto the potential errors due to incorrect sensor readings, unavailability of observation for a period of time, or problems in the data processing pipeline. An intelligent signal imputation method is needed to deal with signal sources that do not report values for a significant period of time. In addition, these signals may have different significant lags i.e. time elapsed between the observed public data to the cyber incident. A systematic way to capture the diverse significant lags with imputed signal values is non-trivial and requires a system-level design. Adding more to the challenge, successful cyber incidents are expected to be rare events for a reasonably protected organization, resulting in imbalanced data. Imbalanced data can lead to biased or inaccurate models where the predictive power of unconventional signals is not captured. This paper provides a comprehensive treatment of all these problems individually and as an integrated system. The overall system is tested using the cyber incident data provided by an anonymized company nicknamed K9.
This research develops an integrated approach that encompasses new and existing solutions for several research challenges known in the Machine Learning community. In addition to analyzing the individual novel solutions, this paper presents a comprehensive analysis of the overall effect of the integrated system. To the best of our knowledge, the set of problems addressed in this work were not considered at the same time in any previous cyber security study. Figure 1 provides a high level overview of the integrated approach presented in this paper. The following highlights the key components in this integrated approach.
-
1.
Unconventional Signals (UCS): Unconventional signals here means the processed public data that are not observables of actual cyberattacks. Instead, they are generated from sources such as GDELT (GDELT 2017), Twitter, and Open Threat Exchange (OTX) (OTX 2017) to forecast cyber incidents.
Fig. 1 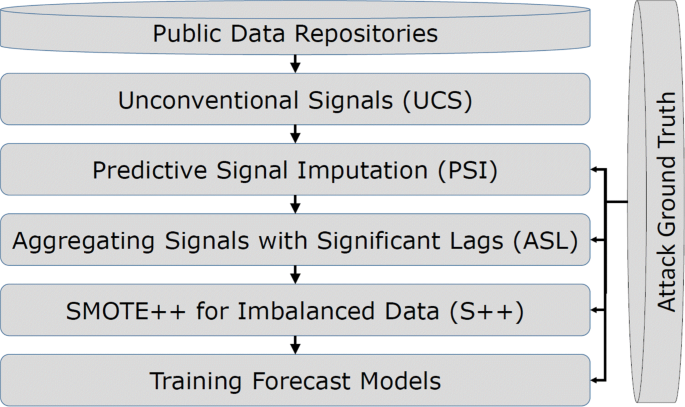
An overview of the integrated cyber incident forecasting system
-
2.
Predictive Signal Imputation (PSI): Using a set of machine learning techniques, including KNN, MLP, and SVMs, missing (incomplete) signals in the cyber data are imputed.
-
3.
Aggregating Signals with Significant Lags (ASL): This work uses cross correlation (CCR) and p-value to determine and aggregate the significant lags of the various unconventional signals.
-
4.
SMOTE++ for Imbalanced Data (S++): This research proposes a hybrid approach that combines under sampling, over sampling and instance weighing, to improve the performance of the prediction models on the imbalanced cyber data sets.

The rest of the paper is organized as follows. “Related work” section presents a brief overview of the previous works addressing cyber attack forecasting as well as the incomplete, insignificant, and imbalanced data problems. “Proposed method” section describes the proposed solutions and the integrated approach. “Experiments and results” section describes the design of experiments, results, and findings, followed by the concluding remarks in “Conclusion” section.
Related work
As cyberattack risks continue to rise, research and development to forecast attacks instead of passively detecting intrusion is needed. In recent years, researchers have started to use predictive analytics that help to forecast future cyber incidents against target organizations before they happen. Yen et al. (2014) examine reports collected from McAfee anti-virus agents deployed on 85,000+ hosts in a multi-national enterprise. Using logistic regression to predict the risk of the hosts encountering a malware, they find out that the highly ranked hosts encountered malware 3 times more compared to the base rate. Liu et al. (2015) collect 258 externally measurable features from the network of an organization that are based on the mis-configured DNS (or BGP) in the network, and the malicious activity time series for spam, phishing, and scanning activities. Training a Random forest classifier using the collected features and reported cyber incidents in the VERIS community database, Hackmageddon, and the Web Hacking Incidents Database, they achieve a 90% accuracy in forecasting breaches against the target organization. Bilge et al. (2017) use the binary file appearance logs and the labeled data from the anti virus and intrusion prevention products of an anti-virus company to predict which machines are at high infection risk. With a Random Forest classifier and Semi-Supervised learning approach, they achieve a high accuracy (a true and false positive rate of 96% and 5%, respectively) in predicting infection risks for hosts.
Unlike the previous cyberattack forecast works, this paper uses unconventional signals which are not necessarily based on the observables of the actual cyberattacks within a target organization. Tetlock and Gardner (2015) stated that a good forecast gathers evidence from a variety of sources rather than using very powerful computing resources or arcane techniques. Some previous studies e.g. (Ramakrishnan and et al. 2014) have shown the viability of using early indicators to forecast future civil unrest incidents. Built upon these premises, several other works (Tabassum et al. 2016; Sliva and et al. 2017; Maimon et al. 2017; Babko-Malaya et al. 2017; Almukaynizi et al. 2017; Sapienza et al. 2017; Okutan et al. 2017b; Okutan et al. 2017a) have shown promising uses of unconventional signals, that is, indirect observables from open source media instead of direct observables of the actual cyberattacks, to forecast cyber incidents. Recognizing the challenges of using unconventional signals as early indicators of future cyberattacks, this paper suggests a set of novel approaches to treat incomplete, insignificant and imbalanced data in the cyber security domain. “Incomplete data”, “Insignificant data”, and “Imbalanced data ” sections below present the previous studies in the machine learning community about these challenges.
Incomplete data
The missing signal values in a data set may affect the quality of the learning process and degrade the performance of the classification algorithms. There are various approaches to combat the missing (incomplete) data problem. One straightforward solution is to ignore the missing signal values; however, the number of training instances could decrease, leading to poor performance. An alternative simple approach is to fill in the missing values with the mean of the existing non-missing values. One may also consider a more complex approach that imputes the missing value using prediction techniques. Saar-Tsechansky and Provost (2007) stated that different types of imputation methods might be preferable over another, based on certain circumstances. Rahman and Davis (2013) used mean or mode, fuzzy unordered rule induction algorithm, decision trees (J48), KNN, and SVM methods to impute missing values in a clinical data set and stated that machine learning methods perform better compared to other imputation techniques. Luengo et al. (2012) used fourteen imputation approaches for the missing values and found that imputation methods outperform the approaches that ignore the missing values. Supporting the previous findings in the literature, they also stated that there was no universal imputation method that performed the best for all classifiers. Farhangfar et al. (2007) provided a comprehensive review of the existing imputation methods and developed a unified framework supporting a set of techniques. They classified the missing value handling approaches into three categories where missing entries in the data were discarded, maximum likelihood procedures were used, and missing values were predicted using either mean imputation or machine learning methods.
A number of techniques were developed for the missing (incomplete) data problem for other applications; however, to the best of our knowledge, it was not treated much in the cyber security domain. This work tests a set of incomplete signal imputation methods to fill in the missing values and shows the increase in the predictive power for forecasting cyber incidents.
Insignificant data
The use of multiple streams of time series data is common outside the field of cyberattack prediction and is especially common in industrial process control. Industrial process data streams, like the data streams utilized in this cyberattack research, have a high level of noise and missing data. A common approach to mitigate these challenges is to aggregate historical data using techniques such as exponential smoothing (Dayal and MacGregor 1997), moving averages (Facco et al. 2009) or exponentially weighted moving averages (Harrou et al. 2015). Facco et al. (2009) used a 3-phase partial least squares regression model to predict the quality of polyester resin and suggested that auto-correlation and cross-correlation could be used to find important lags. The use of 3 lagged values was compared to using the average of a moving window of the last K measurements. They found that using a moving average input to the regression model improves the model performance over the use of lagged values. Harrou et al. (2015) also observed similar benefits when using exponentially weighted moving averages versus single point estimates.
A logical extension of these methodologies is used in this paper, where the significant lags are identified, and then combined together using three aggregation options based on the significance of the correlation of the time series with the ground truth label. The proposed methods provide automated ways to detect the optimal period of time series signals to consider and how to combine the various historical readings together, with the goal to aggregate only those historical data points which show correlation with the output. While Scanlon and Gerber (2015) use time series signals and LDA topics related to web forum traffic to forecast violent extremist recruitment events, a comprehensive method on how best to utilize the time series signals is not incorporated in their study and only ARIMA and exponential smoothing models are considered. To the best of our knowledge, a comprehensive treatment of multiple streams of time series signals for cyberattack prediction has not been studied before.
Imbalanced data
Learning from imbalanced data is a challenging task. Current methods to combat imbalanced data include data-level methods that modify the distribution of the data through either under sampling (removing majority instances) or over sampling (adding minority instances) and algorithm-level methods that tune existing learning algorithms to mitigate the bias towards the majority instances. Furthermore, hybrid methods that combine the approaches in the data-level and algorithm-level approaches are also used (Krawczyk 2016).
Prati et al. used a real data set with artificially modified class distributions to evaluate techniques that treat the imbalanced data problem (Prati et al. 2015). They suggested that existing methods partially recovered the performance losses due to skewness. On average, about 30% or less of the performance loss due to class imbalance was recovered by these methods. Lopez et al. (2013) listed the main approaches to solve the imbalanced data set problem during classification as instance pre-processing, cost-sensitive learning and the use of ensemble methods, and discussed the effect of data intrinsic characteristics. Paula et al. (2015) suggested a slightly different taxonomy of the methods to learn from the imbalanced data as data pre-processing, special-purpose learning (changing existing algorithms to alleviate the imbalanced data bias), prediction post-processing (using a threshold for class membership and cost-sensitive post-processing), and hybrid methods based on the first three approaches. Sun et al. (2011) provided a review for the state-of-the-art research developments on the classification of the imbalanced data and analyzed a set of classifiers to gain insight regarding the difficulties they had with the imbalanced data. They considered network intrusion detection as an example to show that the identification rates of the rare security events are farther behind those of prevalent ones. He and Garcia (2009) provided a review for the nature of the imbalanced data problem, the state-of-the-art approaches to handle the problem, and the current assessment metrics used to evaluate learning performance on the imbalanced data.
Chawla et al. inspired from a technique that proved to be successful in handwritten character recognition (Ha and Bunke 1997), and proposed an over-sampling method where the minority class is over-sampled by generating synthetic instances rather than by over-sampling with replacement. The minority class is over-sampled by generating synthetic instances along the line segments between a minority instance and a subset of its k minority class nearest neighbors (Chawla et al. 2002). They show that when the proposed over-sampling technique is used together with an under-sampling (the majority class), a higher AUC is achieved compared to the case when only under-sampling is applied. Built upon the previous studies that address the imbalanced data problem, this paper proposes, a data pre-processing algorithm named SMOTE++, to handle the imbalanced data problem. Our results show SMOTE++’s benefit to improve the forecasting performance on cyber incidents.
Proposed method
Given a target organization E, and a set of n unconventional signals X={X1,X2,...Xn}, and a set of m attack types A={A1,A2,...Am} for E, this work forecasts the occurrences of future cyber incidents against E, by training binary prediction models using the unconventional signals in X and the entity ground truth for each attack type in A.
This research proposes a comprehensive approach encompassing a set of novel methods, including the use of unconventional signals, predictive signal imputation, a systematic signal aggregation approach, and a filtering method to handle the imbalanced ground truth. A set of unconventional signals including the level of mentions of the K9 target entity, the instability score of the country where K9 operates, the total number of Open Threat Exchange (OTX) pulses from all publishers, and the level of sentiment towards the K9 organization, the defense and banking industries are aggregated (averaged) daily, based on the public data sources i.e. GDELT, Twitter, and OTX. These aggregated signals and the entity ground truth are then used to train binary prediction models to forecast future cyberattacks against K9. The unconventional signals used in this study are explained in “Ground truth data and unconventional signals” section. Once the signals are aggregated daily, the missing values in the data are filled, using one of the imputation methods explained in “Predictive signal imputation” section. To determine the optimum level of aggregation, cross correlation (CCR) is applied to the imputed signals, as detailed in “Aggregating signals with significant lags” section. Finally, “SMOTE++ for imbalanced data” section presents the SMOTE++ filter which tackles the imbalanced data set problem and improves forecast performance.
Ground truth data and unconventional signals
This paper considers a set of cyberattack ground truth data reported for a company, nicknamed K9, for 488 days between July 1, 2016 and October 31, 2017. Three attack types were considered:
-
Endpoint Malware (EM),
-
Malicious Destination (MD),
-
Malicious Email (ME).
Cyber incidents against K9 were recorded and verified daily, by a group of independent professionals for each of the EM, MD, and ME attack types. A ME event was reported when an unsuspecting user received an email containing either a malicious payload (malware) or a link to a malicious domain that included credential-stealing landing pages. A MD event was recorded when a user unknowingly visited, was redirected to, or interacted with a malicious domain where a malicious domain was defined as one that hosted malicious code, delivered a malicious payload, or whose purpose was obfuscated from the user. As a result of a MD event, if a malware got installed an incident of type EM was reported. Figure 2 shows the number of reported daily cyber incidents against K9 for each attack type.

An overview of the daily cyber events against K9
Count based ground truth data were converted to a binary series, by updating all daily count values greater than 1 to 1. Therefore, the binary ground truth series included either a value of 1 (positive) or 0 (negative). Daily averages of the unconventional signals for a day d and the binary entity ground truth for day d+1 are combined to generate data sets for different attack types. Table 1 shows the distribution of the instances in the generated data sets for each attack type in the 488-day period. P and N show the number of instances with positive and negative ground truth values for each attack type respectively. P1% shows the percentage of the positive instances in the original data sets (with missing signals) and P2% shows their percentage when instances with one or more missing signals are removed. We observe that the MD and ME data sets are more imbalanced when instances with missing signal values are removed because there are relatively more missing signals for the instances when one or more cyber attacks are reported compared to the instances with no cyber events.
This work specifically focuses on predicting a single attack in what could be a multi-step attack campaign. Historical attacks were not used as signals for predicting future attacks because there is often a significant lag between the occurrence of an attack and its discovery by network analysts. Therefore, signals used during this research are limited to only those available outside a corporations firewall. These unconventional signals which are pulled from public data sources i.e. GDELT, Twitter, and OTX are not necessarily related to K9, but have a potential to be indicative for future cyberattacks towards it. The signals used in this study are listed in Table 2 and briefly explained in the following sub-sections.
Level of mentions of entities
GDELT is a large open platform that monitors the news and media from around the world. GDELT maintains a set of metrics based on its source documents starting from January 1, 1979. Will increased discussion of an entity in GDELT or social media lead to a cyberattack towards that entity? This paper uses the total number of mentions of the K9 organization and its related keywords in GDELT and Twitter daily, to generate two signals named T_LME and G_LME.
Instability signals
GDELT events are associated with a score between -100 and +100 depending on whether they are negative or positive events. Furthermore, each event has a score named Goldstein that shows the potential impact of the event on the stability of the country where the event takes place. This work calculates the daily averages of the Goldstein score for the negative events filtered for the country where K9 operates, to generate the INSTAB signal.
OTX stat signal
Open Threat Exchange (OTX) is a crowd-sourced open platform supported by more than 65,000 participants from around 140 countries. It is an open threat intelligence community that enables collaborative defense with community-powered threat intelligence. The OTX signal represents the total number of pulses from all publishers (that have 100 or more pulses) in Open Threat Exchange platform.
Sentiment signals
Two sentiment scores i.e. Affect (AFF) and Intensity (INT) are calculated as suggested in a previous study (Preoţiuc-Pietro et al. 2016) based on documents derived from Twitter and GDELT. The daily averages of these scores for the K9 company, Defense, and Banking sectors are used as unconventional signals. The sentiment signals i.e. K9_AFF, K9_INT, DEF_AFF, DEF_INT, BANK_AFF, and BANK_INT are aggregated daily for each target i.e. K9 organization, Defense and Banking sectors.
Predictive signal imputation
Missing data is a key problem in machine learning and has a big impact on learning, inference, and prediction. The data might be missing at random or in a systematic way where a missing value is observed when a particular condition is met. In all cases, missing data is a critical issue and needs special treatment to improve the performance of a prediction model. A simple solution could be to ignore the features with missing signals; however, depending on the amount of the missing signals, that could lead to ignoring the majority of the data set and a significant loss in the predictive power. Another solution is to impute the missing entries with various techniques (Farhangfar et al. 2007; Luengo et al. 2012). For the K9 data set, the number of observations with at least one missing signal is over half of the total entries. This work considers using the predictive imputation methods to impute missing signal values, instead of deleting or ignoring the observations with missing signals.
Support Vector Machines (SVM) (Vapnik 1995) is a supervised learning method that could be used to fill in the missing data (Honghai et al. 2005). This work uses the SMOreg algorithm in Weka 3.8.2 (Hall et al. 2009) - an implementation of SVM for regression. Its learning algorithm is specified by setting the RegOptimizer input parameter in Weka. The RegSMOImproved learning algorithm (Shevade et al. 2000) is used during the SVM-based imputation processes in this paper. The k-nearest neighbor (KNN) is a classification algorithm which is also known as IBk (instance based classifier) (Aha and Kibler 1991). In KNN, an instance is labeled considering the majority label of its k neighbors where k>=1. KNN is one of the widely used techniques to impute missing signal values (Frossard et al. 2016; Zhang et al. 2010; Rahman and Davis 2013). This research uses the IBk algorithm in Weka 3.8.2 with the default parameter set, to impute missing signal values in the K9 data set. Artificial neural networks can be used for classification and decision making processes, because they are able to model the complex non-linear relationships within a data set very well. Multilayer Perceptron (MLP) is a feed-forward artificial neural network technique that can learn a non-linear function for either a classification or regression task. An MLP architecture is composed of at least three layers of nodes i.e. input, hidden, and output, and can distinguish data that is not linearly separable. Previous work shows a limited use of the MLP technique to handle the missing data problems (Leke and Marwala 2016). This paper uses MLP as an alternative approach to estimate the missing signal values. Each MLP model contains an input layer with 10 cells and a hidden layer with 6 cells. The MLP models are created in Weka 3.8.2 with the default learning rate of 0.1.
Given an attack type A, if the jth observation of a signal Xi is missing, the previous j−1 observations of the remaining signals in X and the entity ground truth for A are used as features to train a model with SVM, KNN or MLP to estimate the value for \(X^{j}_{i}\). The algorithm used to impute the missing signals in a data set D using a prediction model μ is summarized in Algorithm 1.

Aggregating signals with significant lags
The set of signals used in this work are a set of time series signals whose values change over time. The use of time series signals as predictors results in a large amount of data. To reduce the amount of data, instead of using the entire history of the time series as input to a prediction model, one can aggregate a number of historical observations, and provide only this aggregated value to the prediction algorithm. This process of aggregating historical time series signals raises a number of questions including: What is the optimum time period to consider while aggregating signals in a data set? If there is a lead time between a signal and a ground truth event, how do we identify this lead time? Should we treat all historical observations equally, or weight them in some way?
Temporal relationships between signals and ground truth can be leveraged to better prepare training data for classification. Cross correlation (CCR) at different time lags between a signal and attack set highlights any temporal relationships. Pre-processing external signal data with correlation based aggregation methods can magnify the effect of relevant measurements on classification. Similar to a previous study (Okutan et al. 2017a), this work suggests to use alternative novel cross correlation based approaches to identify the significant time lags of the unconventional signals for signal aggregation.
Aggregation and lead time based aggregation (ALA)
The first aggregation approach encapsulates all lags of a signal above the significance threshold \(2/\sqrt {n}\) where n is the number of paired measurements. An aggregation period Δt is calculated from the lead time Tl, the most recent signal measurement that is strongly correlated to the ground truth to the least recent significant lag Tm. The signal is aggregated using the mean of historic values falling in the aggregation period such that
Figure 3 illustrates the determination of Δt and Tl from the CCR plot.

An example of how cross correlation is used to find Δt and Tl
Weighted full average based aggregation (WFAA)
The weighted full average method takes into account all lags measured with the CCR and weights them according to their correlation coefficients. The y-value corresponding to each lag in the CCR is a measurement of correlation between the lagged signal and the current ground truth measurements. Weighting the signal values allows aggregation to be more strongly affected by significantly correlated measurements without ignoring any historic data. Aggregation can be represented as
where w is the number of negative lags considered in the CCR and ci is the correlation coefficient corresponding to the i−th lag of the signal.
Weighted significant average based aggregation (WSAA)
The weighted significant average approach looks only at strongly correlated lags when calculating its weighted average. As with the previous method, this allows each significant lag to influence the aggregation relative to its overall correlation to the ground truth. Two methods for determining the threshold V for critical correlation are considered.
-
t−tableSignificance (WSAA-t): The first method uses t-tables with α=.05 to calculate Va, such that
$$ V_{a} = \sqrt{\frac{qt(\alpha /2,n-2)}{qt(\alpha /2,n-2)^{2} + (n-2)}} $$(3)where qt() is the quantile function and n is the length of the series. The critical set of method a is defined as C={(Xi,ci)∣ci>Va}.
-
p−valueSignificance (WSAA-p): The second method determines the p−value for each lag based on its correlation coefficient ci with pi<.05 being considered significantly correlated. p(r) is defined as
$$ p(r)=\frac{e^{\frac{-1}{2}\cdot(\frac{r}{\sqrt{\frac{1-r^{2}}{n-2}}}^{2})}}{\sqrt{\frac{1-r^{2}}{n-2}}\cdot\sqrt{2\pi}} $$(4)where r is the correlation coefficient under investigation and n is the length of the series. The critical set can be defined as C={(Xi,ci)∣p(ci)<.05}. The weighted significant average is calculated using the signal values and correlation coefficients contained in the critical set such that
$$ X_{t} = \frac{1}{\mid C\mid} \sum\limits_{i=1}^{\mid C\mid} C[i].X \cdot C[i].c $$(5)
SMOTE++ for imbalanced data
Imbalanced data problem is observed when the number of positive instances are a lot fewer than the number of negative instances in a given data set. It is observed commonly in various real life problems including medical diagnosis, anomaly detection, and even cyberattack prediction. A machine learning classifier trained on a skewed data set may not be able to learn from the instances with the minority class and therefore may predict the majority class for all test instances. Although the accuracy of the classifier may seem to be very high, in reality the classification will not help to predict the minority (positive) instances. Over sampling the minority instances, under sampling the majority instances or changing the weights (cost) of the minority and majority instances are some of the common data-level approaches applied in the literature to solve the imbalanced data set problem.
In order to combat the imbalanced data problem, data-level and algorithm-level approaches are being improved continuously and hybrid approaches are gaining an increasing level of popularity. This research proposes a novel data-level method for imbalanced learning named SMOTE++ that is a modified version of the Synthetic Minority Over-sampling Technique (SMOTE) (Chawla et al. 2002). SMOTE++ suggests to remove a portion of the majority instances that are close to the minority instances during under-sampling. A systematic way to find these instances is to use the Euclidean distance of the majority instances to the centroid of the minority instances. The k-Means clustering algorithm is used to find the main cluster of the minority instances and their centroid if any. In case the minority instances are not within a cluster, then the centroid of all minority instances is used. When a portion of the majority instances are removed, the total weight of the majority instances changes. Therefore, the weights of the remaining majority instances are increased to have the same total weight for the majority instances. Furthermore, to balance the distributions of the majority and minority instances, SMOTE++ uses a hybrid approach where the weights of the existing minority instances are increased and new synthetic minority instances are introduced. Therefore, when the class distributions of the minority and majority instances are balanced, existing minority instances have a higher weight compared to the newly introduced synthetic minority instances. Assume that SMOTE++ needs to introduce five instances for each minority instance (have a total of six minority instances) to balance the distribution of the majority and minority classes. First, the weights of the existing minority instances are multiplied by three and then three new synthetic minority instances are generated for each minority instance. While creating new minority instances the k- Nearest Neighbor algorithm (with k=3) is used as applied by Chawla et al. (2002). A detailed description of the SMOTE++ method is shown in Algorithm 2.

Experiments and results
Experiment methodology
The unconventional signals used in this paper are not explicitly related to K9, the target organization. In fact, measuring the relevance of each signal with the K9 ground truth is not a straightforward process. On the other hand, Bayesian networks are probabilistic graphical models and are best known for their success in modeling the uncertainties in the data better than other methods. Therefore, a Bayesian classifier is used to forecast specific cyberattacks towards the K9 target organization. During Bayesian structure learning, K2 algorithm proposed by Cooper and Herskovits (1992) is used to search for the most probable network structure. The three novel techniques i.e. Predictive Signal Imputation (PSI), Aggregating Signals with Significant Lags (ASL), and SMOTE++ for Imbalanced Data (S++) are applied to each attack type (EM, MD, and ME), and the Area Under the Receiver Operating Characteristic (ROC) curve (AUC) is used as a performance metric to compare the results.
First, each proposed method is applied to the data set of each attack type separately, in order to check whether it helps to increase the classifier performance. The PSI method uses SVM, KNN or MLP as an underlying algorithm to impute the missing signals. Using AUC as a performance metric, the best performing algorithm for PSI is determined. Similarly, the contribution of the ASL method is measured considering four approaches defined in 2. Finally, the performance of the SMOTE++ filter is evaluated using the data set for each attack type.
After evaluating the contribution of each method individually i.e. PSI, ASL, and S++, the binary tree structure in Fig. 4 is used to apply (or not apply) each method at the same time, resulting in eight leaf cases at the end to compare. A Bayesian classifier is trained and tested for each of these eight test cases for each attack type. The ∼ sign before a method acronym shows that the corresponding method is not applied. For instance, ∼PSI indicates that the Predictive Signal Imputation method is not applied. At the end of the left-most path in the tree, all the methods PSI, ASL and S++ are applied at the same time. First, the missing signals are imputed, then the signals are aggregated based on the selected aggregation method and finally the SMOTE++ filter is applied using the FilteredClassifier with BayesNet, to ensure that the test sets are not affected when the filter is applied. At the end of the right most path in the tree, none of the methods are applied. In that case, the Bayesian classifier is trained and tested on the data where the observations with missing signal values are removed. Applying or not applying a method in each layer of the tree in Fig. 4, eight cases are created at the end. Then, a Bayesian classifier is trained and tested for each of these eight cases for each attack type.

An overview of the comprehensive treatment applied in this paper. A ∼ symbol before the acronym of a method shows that the corresponding method is not applied
Results for PSI
The predictive power of different signal imputation methods are compared using the K9 data set for the EM, MD, and ME attack types. 58% of the instances in the data set include at least one missing signal and the predictive imputation methods i.e. SVM, KNN, and MLP are used to impute these missing signal values. Once the missing signal values are imputed, a BayesNet classifier is used with 10 folds cross validation to calculate the AUC value for each attack type. The AUC values shown in Table 3 are obtained. The values in the row “None” shows the AUC value when no imputation method is applied which means that the instances with missing signals are deleted. We observe that the imputation methods improve the predictive power compared to the case when the instances with missing signal values are deleted. Furthermore, the k-Nearest Neighbor algorithm performs significantly better than the SVM and MLP for EM, MD and ME attack types.
Results for ASL
This work considers different signal aggregation approaches (ASL) explained in “Aggregating signals with significant lags” section i.e. Aggregation and Lead Time Based Aggregation (ALA), Weighted Full Average Based Aggregation (WFAA), Weighted Significant Average Based Aggregation with a t-table (WSAA-t), and Weighted Significant Average Based Aggregation with a p-value (WSAA-p).
These approaches are evaluated and their performance is compared with the baseline where the daily aggregated signals for the EM, MD, and ME attack types are used. To measure the contribution of the signal aggregation methods individually, without using a signal imputation method, the instances with missing signal values are removed. Therefore, the EM, MD, and ME data sets are left with 207 instances, out of the 488 total instances in the original data that included missing values.
The BayesNet classifier in Weka is used with 10 folds cross validation, and the AUC values for each method is found for each attack type. AUC values for the daily signals and when the signals are aggregated with different approaches are shown in Table 4. The column labeled “None” shows the AUC values when no further aggregation is used and only daily aggregations of the signals are used. We observe that the WSAA-t approach improves the classification performance for the Endpoint Malware (EM) and Malicious Email (ME) attack types. However, the AUC value when the WSAA-t method is used is the same with the AUC value of the base line for the Malicious Destination (MD) attack type.
Results for SMOTE++
When instances with missing signal entries are removed, the percentages of the positive instances (days with one or more cyberattack) are 67, 13, and 13 for the data sets of the EM, MD, and ME attack types, respectively. Excluding the EM data set, the number of the positive instances are significantly lower than the number of negative instances. We apply the S++ filter described in “SMOTE++ for imbalanced data” section to all data sets and check if the performance of a BayesNet classifier is improved in terms of AUC. To cross check our results against a baseline, we also use the SMOTE (Chawla et al. 2002) as an alternative filter. For S++ and SMOTE, a FilteredClassifier with a BayesNet classifier is trained and tested in Weka using a 10 folds cross validation approach. Furthermore, the percentage (p) parameter of S++ is tuned, and p=5.0 is used while under-sampling each data set. Moreover, five nearest neighbors of each minority instance is considered during over-sampling i.e. while generating synthetic minority instances. On the other hand, the percentage parameter of the SMOTE filter is adjusted for each data set, in order to have a uniform class distribution.
Once again, instances with missing signal values are deleted from the daily aggregated signals before applying a filter, to evaluate the contribution of a filter individually without considering PSI. The AUC values obtained when the S++ and SMOTE filters are applied are shown in Table 5 for all attack types. The column labeled “None” lists the AUC values for the signals (with missing entries removed) when no filters are applied. We observe that the proposed S++ filter improves the performance of a BayesNet classifier for all attack types compared to the baseline case labeled with with “None”. Furthermore, S++ filter performs better than the SMOTE filter for all attack types.
Results when PSI, ASL, and S++ applied
In “Results for PSI”, “Results for ASL”, and “Results for SMOTE++” sections, the contribution of each proposed method i.e. PSI, ASL and S++ is evaluated individually for the EM, MD, and ME attack types. In this section, the performance of a BayesNet classifier is compared when these methods are applied together. “Results for PSI” section showed that KNN performs better than other imputation algorithms i.e. SVM, MLP. Therefore, this section uses KNN as the underlying algorithm during the PSI processes. Furthermore, the WSAA-t method was shown to perform better than other aggregation methods i.e. ALA, WFAA and WSAA-p. Therefore, the WSAA-t method is used to aggregate daily signals over the significant lags in the past for each ASL process. Lastly, to tackle the imbalanced data set problem, the SMOTE++ filter is used during each S++ process.
The AUC values obtained, when each of the PSI, ASL and S++ methods is applied to the EM, MD and ME cases are shown in Table 6. The PSI, ASL, and S++ columns indicate whether a method is applied (+) or not (-). For example, case 1 shows the AUC values when all methods are applied, whereas case 8 lists the AUC values when none of the methods are applied. The FilteredClassifier (with a BayesNet) is used with 10-fold cross validation to calculate the AUC values in each case when the S++ method is used. When all three methods are applied, first PSI is used to predict and impute the missing signal values into the data set. Then, the ASL method is applied to aggregate each daily signal over the previous signal values taking into account the significant lags found by the WSAA-t method. Lastly, the S++ filter is used to obtain an AUC value for the BayesNet classifier. Depending on the + or − signs, an integrated approach is used to calculate the AUC value for each attack type in the remaining cases (between 2 and 8) in Table 6.
When all methods are considered at the same time, the cases between 1 and 4 show that if PSI is used, the best AUC value is found when S++ is applied and no ASL is used (case 3). Case 3 shows that AUC values of 0.87, 0.90 and 0.96 are achieved for the EM, MD, and ME attack types, respectively. It seems that the ASL method is not always helping when the PSI method is applied. This is because the imputed signals might introduce too many artifacts that negatively impact the significant lags found using ASL. On the other hand, the cases between 5 and 8 show that when the PSI method is not applied, better AUC values might be obtained when the ASL and S++ methods are applied at the same time as shown in case 5 in Table 6. The AUC values are found to be 0.60 and 0.85 for the EM and ME attack types, respectively. Using ASL on top of the PSI does not seem to improve the forecast performance of the integrated approach. However, when no PSI is used, using ASL without a PSI may lead to an improvement in the overall prediction performance. Because, the AUC values in case 5 are higher than the AUC values in case 7 for EM and ME attack types. Similarly, the AUC values in case 6 are higher when compared to the AUC values in case 8 for the MD and ME attacks.
In addition to cross-validation, we further examine in more detail how the integrated approach forecasts the cyberattacks for each of the last 6 months between May 2017 and October 2017. For each month, the data available until then is used for training and the data within the forecasted month are used for testing. The three relatively better performing Cases 1, 3, and 4 in Table 6 i.e. [+ + +], [+ - +], and [+ - -] are compared against each other. Figures 5, 6, and 7 show the F-Measure values for cases 1, 3 and 4 in each month for the EM, MD, and ME attack types, respectively. Note that the F-Measure for the baseline [- - -] case was observed to be zero for the MD and ME attack types and the model was always predicting positive for the EM attack type where the percentage of the positive instances is much higher compared to MD and ME attack types. Therefore, the F-Measure values of the [- - -] case are not plotted.

F-Measure values for (+ + +), (+ - +), and (+ - -) cases for each tested month for the EM attack type

F-Measure values for (+ + +), (+ - +), and (+ - -) cases for each tested month for the MD attack type

F-Measure values for (+ + +), (+ - +), and (+ - -) cases for each tested month for the ME attack type
Overall, the [+ - +] case still performs the best over time, with the exception of Aug-17 for the ME attack type, where the [+ + +] case outperforms it. A reason to assess the performance over time is to examine how the variation in the ground truth data might affect the system performance. It is observed that there are higher variations for the MD and ME attack types than the EM attack. In fact, all three cases see zero F-Measure in May-17 for the MD attack type. This is due to the fact that no malicious destination (MD) events were reported in the ground truth during May-17, as shown in Table 7, which gives the number of days where at least one cyber incident is observed. Other than the special situations, the [+ - +] case performs quite well with F-Measure ranging between approximately 0.6 to 1.0, with the [+ + +] case follows not that far behind. Interestingly, although the AUC values of Case 4 seem to be the same as Case 3 for ME attack type in Table 6, its F-Measure over time is lower when compared to Case 3.
To gain more insights into how the unconventional signals defined in “Ground truth data and unconventional signals” section help forecast cyberattacks, we look at the Bayesian networks generated by Cases 1, 3 and 4 for each of the last six tested months between May-17 and Oct-17. For this analysis, a signal is regarded as relevant if its node is connected to the ground truth node in the generated Bayesian network. Figure 8 uses a black filled circle to indicate that a signal is relevant, and an unfilled one to show that it is not. First, when no PSI, ASL and S++ method is used (case 8), except for the ME attack type in Oct-17, no signal relevance is found. However, when an integrated approach is used most of the signals have found to be relevant. The sentiment signals are more indicative for all attack types compared to other signals, the OTX signal is not important in any of the learned networks and GDELT based level of mentions and instability signals seem to have a limited effect.

The importance of signals for EM, MD and ME attack types between May-17 and Oct-17 for cases 1, 3, and 4
Although the T_LME signal has a limited significance in the Bayesian networks generated by Cases 3 and 4, it seems to be important for EM and ME attack types for Case 1 i.e. when ASL is used. Considering the fact that T_LME and INSTAB have 4.1 and zero percent missing values and around half of the sentiment signals are missing (as seen in Table 2), we run another experiment for EM and ME attack types, where ASL is applied for the T_LME and INSTAB signals only. A significant improvement is observed in the F-Measure values of both EM and ME attack types. Previously, the F-Measure values of the ME attack type were 0.55, 0.78, and 0.55 for May, July and September, respectively, when ASL is applied for all signals. However, these values become 0.78, 0.95, and 0.65, respectively, when ASL is applied only for T_LME and INSTAB. Similarly, the F-Measure of the EM for May and July have increased from 0.83 and 0.77 to 0.92 and 0.96, respectively. We conclude that aggregating a signal over the past significant lags may increase its predictive capability even more, if it has less missing signal values. On the other hand, using ASL for imputed signals may not help, because the imputed signals might be introducing artifacts to negatively affect the significant lags found using ASL.
There are several prior works which forecast future cyber incidents against target organizations before they happen and achieve quite high accuracies. For example, the work by Liu et al. (2015) used features from within the network of a target organization to achieve a high accuracy of 90% in forecasting breaches against a target organization. Similarly, Bilge et al. (2017) obtained a high true positive rate of 96% and a low false positive rate of 5% in the prediction of infection risks of hosts. Similar to a previous work by Yen et al. (2014), both of these works use internal signals from within the the network of a target organization to achieve a high forecast accuracy. Once again, we would like to point out that, unlike the previous cyberattack forecast works this paper uses unconventional signals which are not necessarily based on the observables of the actual cyberattacks within a target organization. Therefore, the F-Measure values obtained during this research are not as high when compared to the previous works, but the overall results are quite promising as the forecasts are based on the unconventional signals rather than internal signals retrieved from an anti virus or intrusion prevention software within a corporate firewall.
Conclusion
This work uses unconventional signals derived from Twitter, GDELT and OTX open platforms, to predict cyberattacks towards a target organization anonymized as K9, for the endpoint-malware, malicious-destination, and malicious-email attack types. Novel approaches are proposed for a set of critical challenges in cyberattack prediction, to deal with the incomplete, imbalanced and insignificant data.
To enable cyberattack forecast with incomplete data, a novel predictive signal imputation technique (PSI) that is based on the SVM, MLP, and KNN algorithms is used to fill in the missing values in the signals. It was shown that KNN performs better than other approaches and the proposed predictive imputation method helps to improve the prediction performance of a BayesNet classifier in terms of the AUC.
The significance of the unconventional signals may not always be the same. To consider the significant observations more than the insignificant ones, a cross correlation based signal aggregation approach (ASL) is used to aggregate signals over the past significant lags. Several approaches including ALA, WFAA, WSAA-t, and WSAA-p are compared using the K9 data set and it was shown that WSAA-t helps to improve the cyberattack prediction performance in terms of the AUC.
Similar to the traditional fraud and anomaly detection problem, the number of positive instances might be less than the negative ones in the cyberattack prediction data. With an imbalanced data set, the performance of a cyberattack classifier may not be so good. To deal with the imbalanced data set problem in the cyber security domain, this paper proposes to use a novel filtering approach S++. It is shown that applying S++ to the imbalanced data increases the performance of a BayesNet classifier in terms of the AUC.
Based on the thorough assessment of each individual methods, the PSI, ASL and S++ methods are applied to the K9 data set at the same time. It was shown that when missing signals are imputed, the use of S++ increases the model performance up to 87%, 90%, and 96% AUC for predicting endpoint-malware, malicious-destination, and malicious-email attacks, respectively. Our results show the robustness of cyberattack forecasting where the integrated results provide approximately 0.6 to 1.0 F-Measure over time. The proposed framework enables assessment of the relevance of unconventional signals for forecasting cyberattacks. A careful integrated use of PSI, ASL, and S++ without overly using the imputed signals to determine the significant lags can offer even better and more robust performance.
This work addresses the problem of predicting the occurrences of a type of an attack, whether the actual attack requires single or multiple steps to achieve the goal. Some of the signals are meant to detect earlier steps in an attack cycle that do not involve engaging the actual network infrastructure. The results have shown that the predictive capability of the signals change over time depending on the attack type. Because the relationship of the unconventional signals and the entity ground truth seems to be non-stationary, using a cumulative training window may not always be a good idea. Therefore, as a future work the idea of concept drift will be used to dynamically define an optimum training window for the forecast models. Furthermore, the determination of the significant lags would be automated for relevant signals, in order to enable the forecast system to be adaptive to the diverse and varying characteristics of the unconventional signals and ground truth data.
References
Accenture Security (2017) Cost of cyber crime study. https://www.accenture.com/us-en/insight-cost-of-cybercrime-2017. Accessed 5 Jan 2018.
Aha, D, Kibler D (1991) Instance-based learning algorithms. Mach Learn 6:37–66.
Al-Jarrah OY, Yoo PD, Muhaidat S, Karagiannidis GK, Taha K (2015) Efficient machine learning for big data: A review. Big Data Res 2(3):87–93. https://doi.org/10.1016/j.bdr.2015.04.001.
Almukaynizi, M, Nunes E, Dharaiya K, Senguttuvan M, Shakarian J, Shakarian P (2017) Proactive identification of exploits in the wild through vulnerability mentions online In: Proceedings of the 2017 International Conference on Cyber Conflict (CyCon U.S.), 82–88.
Babko-Malaya, O, Cathey R, Hinton S, Maimon D, Gladkova T (2017) Detection of hacking behaviors and communication patterns on social media In: Proceedings of the 2017 IEEE International Conference on Big Data, 4636–4641.
Baumeister, RF, Vohs KD, DeWall CN, Zhang L (2007) How emotion shapes behavior: Feedback, anticipation, and reflection, rather than direct causation. Personal Soc Psychol Rev 11(2):167–203.
Bilge, L, Han Y, Dell’Amico M (2017) Riskteller: Predicting the risk of cyber incidents In: Proceedings of the 2017 ACM SIGSAC Conference on Computer and Communications Security (CCS), 1299–1311.. ACM, New York. https://doi.org/10.1145/3133956.3134022.
Branco, P, Torgo L, Ribeiro RP (2015) A survey of predictive modelling under imbalanced distributions. CoRR abs/1505.01658. http://arxiv.org/abs/1505.01658, 1505.01658.
Chawla, NV, Bowyer KW, Hall LO, Kegelmeyer WP (2002) Smote: Synthetic minority over-sampling technique. J Artif Intell Res 16(1):321–357.
Cooper, GF, Herskovits E (1992) A bayesian method for the induction of probabilistic networks from data. Mach Learn 9(4):309–347.
Dayal, B, MacGregor JF (1997) Recursive exponentially weighted PLS and its applications to adaptive control and prediction. J Process Control 7:169–179.
Facco, P, Doplicher F, Bezze F, Barolo M (2009) Moving average PLS soft sensor for online product quality estimation in an industrial batch polymerization process. J Process Control 19:520–529.
Farhangfar, A, Kurgan LA, Pedrycz W (2007) A novel framework for imputation of missing values in databases. IEEE Trans Syst Man Cybern Syst Hum 37(5):692–709.
Frossard, DEN, Nunes IO, Krohling RA (2016) An approach to dealing with missing values in heterogeneous data using k-nearest neighbors. CoRR abs/1608.04037. http://arxiv.org/abs/1608.04037. 1608.04037.
GDELT (2017) The gdelt project. http://www.gdeltproject.org/. Accessed 6 Feb 2017.
Ha, TM, Bunke H (1997) Off-line, handwritten numeral recognition by perturbation method. IEEE Trans Pattern Anal Mach Intell 19(5):535–539. https://doi.org/10.1109/34.589216.
Hall, M, Frank E, Holmes G, Pfahringer B, Reutemann P, Witten IH (2009) The WEKA data mining software: An update. SIGKDD Explor 11(1):10–18.
Harrou, F, Nounou MN, Nounou HN, Madakyaru M (2015) Pls-based ewma fault detection strategy for process monitoring. J Loss Prev Process Ind 36:108–119.
He, H, Garcia EA (2009) Learning from imbalanced data. IEEE Trans Knowl Data Eng 21(9):1263–1284.
Honghai, F, Guoshun C, Cheng Y, Bingru Y, Yumei C (2005) A SVM regression based approach to filling in missing values. In: Khosla R, Howlett RJ, Jain LC (eds)Proceedings of the the Knowledge-Based Intelligent Information and Engineering Systems, 581–587.. Springer Berlin Heidelberg, Berlin, Heidelberg.
Khandpur, RP, Ji T, Jan STK, Wang G, Lu C, Ramakrishnan N (2017) Crowdsourcing cybersecurity: Cyber attack detection using social media. CoRR abs/1702.07745. http://arxiv.org/abs/1702.07745. 1702.07745.
Krawczyk, B (2016) Learning from imbalanced data: open challenges and future directions. Progress Artif Intell 5(4):221–232.
Leke, C, Marwala T (2016) Missing data estimation in high-dimensional datasets: A swarm intelligence-deep neural network approach. CoRR abs/1607.00136. http://arxiv.org/abs/1607.00136. 1607.00136.
L’Heureux, A, Grolinger K, Elyamany HF, Capretz MAM (2017) Machine learning with big data: Challenges and approaches. IEEE Access 5:7776–7797. https://doi.org/10.1109/ACCESS.2017.2696365.
Liu, Y, Sarabi A, Zhang J, Naghizadeh P, Karir M, Bailey M, Liu M (2015) Cloudy with a chance of breach: Forecasting cyber security incidents In: Proceedings of the 24th USENIX Security Symposium (USENIX Security 15), 1009–1024.. USENIX Association, Washington, DC.
Lopez, V, Fernondez A, Garcia S, Palade V, Herrera F (2013) An insight into classification with imbalanced data: Empirical results and current trends on using data intrinsic characteristics. Inf Sci 250:113–141. https://doi.org/10.1016/j.ins.2013.07.007.
Luengo, J, García S, Herrera F (2012) On the choice of the best imputation methods for missing values considering three groups of classification methods. Knowl Inf Syst 32(1):77–108.
Maimon, D, Fukuda A, Hinton S, Babko-Malaya O, Cathey R (2017) On the relevance of social media platforms in predicting the volume and patterns of web defacement attacks In: Proceedings of the 2017 IEEE International Conference on Big Data (Big Data), 4668–4673.
Okutan, A, Werner G, McConky K, Yang SJ (2017a) POSTER: Cyber attack prediction of threats from unconventional resources (CAPTURE) In: Proceedings of the 2017 ACM SIGSAC Conference on Computer and Communications Security, CCS ’17, 2563–2565.. ACM, New York. https://doi.org/10.1145/3133956.3138834.
Okutan, A, Yang SJ, McConky K (2017b) Predicting cyber attacks with bayesian networks using unconventional signals In: Proceedings of the Cyber and Information Security Research (CISR) Conference, 1–4.
Okutan, A, Yang SJ, McConky K (2018) Forecasting cyber attacks with imbalanced data sets and different time granularities. CoRR abs/1803.09560. http://arxiv.org/abs/1803.09560. 1803.09560.
OTX (2017) Alienvault open threat exchange. https://www.alienvault.com/open-threat-exchange. Accessed 21 Dec 2017.
Prati, RC, Batista GEAPA, Silva DF (2015) Class imbalance revisited: a new experimental setup to assess the performance of treatment methods. Knowl Inf Syst 45(1):247–270.
Preoţiuc-Pietro, D, Schwartz HA, Park G, Eichstaedt J, Kern M, Ungar L, Shulman E (2016) Modelling valence and arousal in facebook posts In: Proceedings of Workshop on Computational Approaches to Subjectivity, Sentiment and Social Media Analysis (WASSA), Proceedings of NAACL-HLT, 9–15.
PwC (2016) The global state of information security survey 2016. http://www.pwc.ru/gsiss2016. Accessed 6 Feb 2017.
Rahman, MM, Davis DN (2013) Machine Learning-Based Missing Value Imputation Method for Clinical Datasets, 245–257.. Springer Netherlands. https://doi.org/10.1007/978-94-007-6190-2_19.
Ramakrishnan, N, et al. (2014) ’beating the news’ with embers: Forecasting civil unrest using open source indicators In: Proceedings of the 20th ACM SIGKDD International Conference on Knowledge Discovery and Data Mining, KDD ’14, 1799–1808.. ACM, New York. https://doi.org/10.1145/2623330.2623373.
Saar-Tsechansky, M, Provost F (2007) Handling missing values when applying classification models. J Mach Learn Res 8:1623–1657. http://dl.acm.org/citation.cfm?id=1314498.1314553.
Sapienza, A, Bessi A, Damodaran S, Shakarian P, Lerman K, Ferrara E (2017) Early warnings of cyber threats in online discussions In: Proceedings of the 2017 IEEE International Conference on Data Mining Workshops (ICDMW), 667–674.
Scanlon, J, Gerber M (2015) Forecasting violent extremist cyber recruitment. IEEE Trans Inf Forensics Secur 10:2461–2470. https://doi.org/10.1109/TIFS.2015.2464775.
Shevade, SK, Keerthi SS, Bhattacharyya C, Murthy KRK (2000) Improvements to the SMO algorithm for SVM regression. IEEE Trans Neural Netw 11(5):1188–1193.
Sliva, A, et al. (2017) Hybrid modeling of cyber adversary behavior In: Proceedings of the Social, Cultural, and Behavioral Modeling, 133–138.. Springer International Publishing.
Sun, Y, Wong A, Kamel MS (2011) Classification of imbalanced data: a review. Int J Pattern Recognit Artif Intell 23:687–719.
Tabassum, J, Ritter A, Xu W (2016) A minimally supervised method for recognizing and normalizing time expressions in twitter. CoRR abs/1608.02904. http://arxiv.org/abs/1608.02904. 1608.02904.
Tetlock, PE, Gardner D (2015) Superforecasting: The Art and Science of Prediction. Crown Publishing Group, New York.
Vapnik, VN (1995) The Nature of Statistical Learning Theory. Springer-Verlag Inc., New York.
Yen, TF, Heorhiadi V, Oprea A, Reiter MK, Juels A (2014) An epidemiological study of malware encounters in a large enterprise In: Proceedings of the 2014 ACM SIGSAC Conference on Computer and Communications Security, CCS ’14, 1117–1130.. ACM, New York. https://doi.org/10.1145/2660267.2660330.
Zhang, S, Wu X, Zhu M (2010) Proceedings of Cognitive Informatics (ICCI), 2010 9th IEEE International Conference on In: Efficient missing data imputation for supervised learning, 672–679.
Acknowledgements
This research is supported by the Office of the Director of National Intelligence (ODNI) and the Intelligence Advanced Research Projects Activity (IARPA) via the Air Force Research Laboratory (AFRL) contract number FA875016C0114. The U.S. Government is authorized to reproduce and distribute reprints for Governmental purposes notwithstanding any copyright annotation thereon. Disclaimer: The views and conclusions contained herein are those of the authors and should not be interpreted as necessarily representing the official policies or endorsements, either expressed or implied, of ODNI, IARPA, AFRL, or the U.S. Government.
Funding
Intelligence Advanced Research Projects Activity (IARPA) with contract number FA875016C0114.
Availability of data and materials
The data used during this research will not be shared, because it belongs to a private enterprise and is protected by a confidentiality agreement.
Author information
Authors and Affiliations
Contributions
AO: The lead researcher and author. GW: Helped to document and implement the proposed “Aggregating Signals with Significant Lags (ASL)” approach. SJY: Contributed to develop the presented research ideas and helped in writing. KM Contributed to develop the presented research ideas and helped in writing. All authors read and approved the final manuscript.
Corresponding author
Ethics declarations
Competing interests
All authors declare that they have no competing interests.
Publisher’s Note
Springer Nature remains neutral with regard to jurisdictional claims in published maps and institutional affiliations.
Rights and permissions
Open Access This article is distributed under the terms of the Creative Commons Attribution 4.0 International License (http://creativecommons.org/licenses/by/4.0/), which permits unrestricted use, distribution, and reproduction in any medium, provided you give appropriate credit to the original author(s) and the source, provide a link to the Creative Commons license, and indicate if changes were made.
About this article

Cite this article
Okutan, A., Werner, G., Yang, S. et al. Forecasting cyberattacks with incomplete, imbalanced, and insignificant data. Cybersecur 1, 15 (2018). https://doi.org/10.1186/s42400-018-0016-5
Received:
Accepted:
Published:
DOI: https://doi.org/10.1186/s42400-018-0016-5