- Research
- Open access
- Published:
Aparecium: understanding and detecting scam behaviors on Ethereum via biased random walk
Cybersecurity volume 6, Article number: 46 (2023)
Abstract
Ethereum’s high attention, rich business, certain anonymity, and untraceability have attracted a group of attackers. Cybercrime on it has become increasingly rampant, among which scam behavior is convenient, cryptic, antagonistic and resulting in large economic losses. So we consider the scam behavior on Ethereum and investigate it at the node interaction level. Based on the life cycle and risk identification points we found, we propose an automatic detection model named Aparecium. First, a graph generation method which focus on the scam life cycle is adopted to mitigate the sparsity of the scam behaviors. Second, the life cycle patterns are delicate modeled because of the crypticity and antagonism of Ethereum scam behaviors. Conducting experiments in the wild Ethereum datasets, we prove Aparecium is effective which the precision, recall and F1-score achieve at 0.977, 0.957 and 0.967 respectively.
Introduction
Ethereum is the most popular public chain in the blockchain 2.0 era (Etherscan). Relying on smart contracts, Ethereum has an extremely rich business scope (Badari and Chaudhury 2021). It is precisely because of Ethereum’s convenient characteristics that the huge interest temptation has attracted a large number of attackers. The blockchain is experiencing an increasing number of significant security incidents (BCSEC), with the business layer being the most affected, accounting for 51.31% of the overall economic loss. Scam behavior emerges as the primary factor behind these losses. The second is phishing, and the third is fakeICO (Initial Coin Offering) (Etherscan). Among them, phishing and fakeICO are part of the scam. According to the “2022 Crypto Crime Report” (Chainanalysis), scams caused losses of 14 billion in 2021, double the 7.8 billion in 2020. It can be seen that the malicious behavior of scams on the chain needs to be paid attention to.
Cryptocurrency scams are investment fraud (Ethereum), involving a crime of funds embezzling from participants who want to profit from digital currency. Cryptocurrency scam behavior can generally be divided into two types (MURPHY). The first is a series of actions to gain access or authentication rights to the target digital wallet and evade tracking, i.e. activities to obtain private information such as private keys, which may include access to secure hardware, etc. The second stage involves exploiting the victim’s psychological factors through deceptive financial tactics, such as fake investment schemes using blockchain characteristics to persuade them to avoid detection and tracking. We mainly study the life cycle and risk identification points of the second type of scam behavior, a high-level behavior, to understand and detect this behavior.
There is less investigation and understanding work on the blockchain. Su et al. (Su et al. 2021) conducted a investigation on Dapp’s malicious behavior, and the rest of the work focused on the overall understanding of Ethereum, including normal transaction behavior analysis (Chen et al. 2020c; Ao et al. 2021; Ron and Shamir 2013), while the investigation of the scam behavior chain and the mining of intermediate gray nodes need more work. The records of transactions on the chain can be modeled as graphs naturally. The current construction methods are roughly divided into random time period based (Sayadi et al. 2019), random address based (Lin et al. 2020a) and policy-based selective address based method (Ao et al. 2021; Wu et al. 2020), but the graph construction strategy for sample sparsity processing needs to be studied urgently. In the field of on-chain behavior detection, unsupervised learning was adopted in the early stage (Pham and Lee 2016), and after the accumulation of intelligence, the supervised machine learning algorithm was used for detection (Chen et al. 2018). However, the early feature extraction generally directly uses the attributes recorded on the chain with some simple statistical features (Monamo et al. 2016; Sayadi et al. 2019), which have low accuracy. Graph representation learning (Perozzi et al. 2014; Grover and Leskovec 2016; Weber et al. 2019) and deep learning (Kipf and Welling 2016; Hamilton et al. 2017) may extract more complex feature at a high level to improve the detection effectiveness. Although the above method achieved a certain degree of success, the Ethereum scam behavior study is still need more exploration. For more related research, see Section Background and Related Work.
The challenge for the detection of scam behavior generalized as follow:
-
Crypticity Scams on Ethereum mostly exploit the information asymmetry between the victim and the fraudster and the anonymity of Ethereum itself. It is difficult for the victim to aware the scam for a short period of time, and to achieve entity penetration to recover the loss afterwards. However, it is challenging to understand Ethereum scam behavior by analyzing the addresses behavior over time to stop losses beforehand.
-
Sparsity In Ethereum with more than 500 million addresses, there are less than 2,000 scam behavior markers(Etherscan). It can be seen that detecting scam behavior on the chain is like looking for a needle in a haystack.
-
Antagonism Scam gangs will conduct sophisticated transfers to counter existing detection mechanisms. For example, using waterhouse mules and currency mixing services to conduct long path transfers to cover up criminal facts. Therefore, it is urgent to develop detection methods that can capture the criminal processes.
In response to the above challenges, the structure of our study shows as Fig. 1.
-
We attempt at investigation and understanding Ethereum scam behavior at the node interaction level. Our research uncovers a common and unique Ethereum scam malicious behavior life cycle, and gives a comparison of scam identification points for different types of addresses. This transparent analysis method can help remedy being cheated beforehand.
-
We model this detection problem as node classification. To further fit the scam identification points and realize automatic detection, we propose a novel detection method named Aparecium to solve it. Aparecium comes from the spell in Harry Potter, which means manifesting. We generate the Ethereum transactions graph using a method which retains as much scam behavior scene data as possible. It also retains the complete scam chain without losing the intermediate crime process to mitigate the sparsity. On this graph, we capture the network structure, pure semantics, and time mixed features by our biased sampling method with adjustable weight and classify the node by the random forest model.
-
We conduct experiments in the wild Ethereum world and prove Aparecium is effective. Experimental results show that, the precision, recall and F1-score achieve at 0.977, 0.957 and 0.967 respectively, which is outperform than the other compared method.
Fig. 1 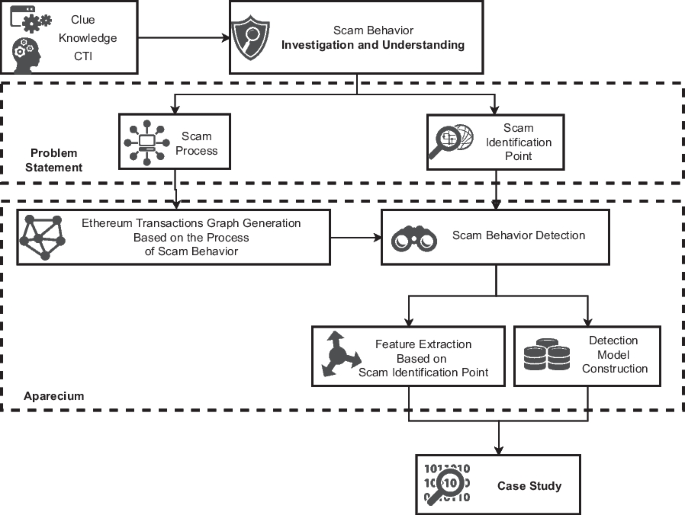
The framework of our study

Background and related work
Blockchain Scam Behavior Investigation and Understanding During this year, more and more methods to extract high-order features of events have been put into the field of abnormal behavior detection (Alsulami 2022; Manoj and Bhaskari 2016; Chhabra et al. 2020). They use deep learning-based method (Do Xuan and Dao 2021; Yu et al. 2021a) or graph-based method (Irshad et al. 2021) to make advanced persistent threat (APT) detection. However, there are relatively few abnormal behavior investigations and understanding works on the blockchain. Su et al (Su et al. 2021). proposed to use long short-term memory (LSTM) to extract time-series features from the Ethereum dynamic contract call graph to detect anomaly behavior in contract interaction and the stage of the attack. The rest of the work focuses on the analysis of various behaviors (not limited to abnormal behaviors) on Ethereum, like (Chen et al. 2020c),(Ao et al. 2021), (Ron and Shamir 2013).
Blockchain Transaction Graph Construction In Ethereum, not limited to the transfer behaviors, calls between smart contracts are also recorded on the chain in the form of transactions. To analyze anomalies and behaviors on the blockchain, a suitable approach is to model the data as a graph structure. However, the massive amount of data in the blockchain is not easier analysis and detection. So it is necessary to construct transaction subgraphs by pruning irrelevant information without losing valuable data. Current construction methods can be divided into random time period based (Sayadi et al. 2019), random address based (Lin et al. 2020a) and policy-based selective address based (Ao et al. 2021; Wu et al. 2020) method. Due to the sparseness of abnormal samples in a period of time, the pruning effect is not ideal. In order to improve the efficiency of model training, the graph construction strategy for abnormal behavior of Ethereum needs to be studied urgently.
Blockchain Abnormal Behavior Detection In the early stage of blockchain development, unsupervised machine learning methods were often used. These methods usually combine with attack data constructed by researchers and extract features of potential malicious behaviors on the chain for detection. It generally uses raw data (such as amount, transaction fee, etc.) and network characteristics (in-degree, out-degree, etc.) directly available from the chain as algorithm input (Pham and Lee 2016; Monamo et al. 2016; Sayadi et al. 2019). With the deepening of on-chain behavior research, supervised machine learning algorithms were used commonly, cooperating with the accumulated labeled datasets to extract features according to the importance of features in the process of algorithm classification (Chen et al. 2018; Ostapowicz and Żbikowski 2019a). After the graph representation algorithms developing, structure-based graph representation learning algorithms (Perozzi et al. 2014; Grover and Leskovec 2016; Tang et al. 2015) and graph representation learning algorithms that combine attributes (Hu et al. 2019; Wu et al. 2020; Lin et al. 2020a; Weber et al. 2019) are used commonly. Although there have been achieve some success, the adaptation of the method to the abnormal behavior on the chain needs to be improved. Meanwhile, the feature extraction work that is highly adapted to the scam behavior on the Ethereum chain still needs to be further studied.
Behavior investigation and understanding
We manually investigated and analyzed the behavior chains and features of malicious addresses using the Ethereum visualization tool (breadcrumbs) and the Ethereum token browser (Etherscan; Ethplorer). We found the Ethereum transactions scam abnormal behavior process and its corresponding typical suspicious features.
Ethereum transactions scam abnormal behavior process
After manual investigation and analysis of malicious addresses, we try to restore the attack site and study the chain of abnormal behavior in-depth. We found that the scam behavior on Ethereum usually goes through 4 stages. The overview is shown in Fig. 2, and more specific examples will be analyzed later in Section Case Study.
After thorough examination and analysis of malicious addresses, reconstructing the attack site, and studying the sequence of anomalous activities, we have identified a clear four-stage progression in the deceptive practices observed on Ethereum. A comprehensive overview of these stages is presented in Fig. 2, while detailed illustrations and analyses of specific instances will be provided subsequently in Section Case Study..

The overview of the Ethereum scam behavior process
The first stage is the Bait Collection stage, and the main goal of which is to collect preliminary information. In this stage, bait collectors mainly collect source data such as vulnerability information, target financial interest information, etc., and make the bait with the assistance of bait packers, so as to prepare for further accurate bait placement.
The second stage is the Trap Exploitation stage, the main goal of which is to attract funds. Attackers through hiding contract code, using false advertisements, deliberately releasing exploitation as bait to lure other greedy attackers, making fakeICO, and directly using exploitation (such as contract reentrancy attacks) methods, transfer funds from victims to the waterhouse manager.
The third stage is the Lateral Transfer stage, the main goal of which is to quickly wash out the suspects after the first two stages of exposure, so as to prepare for cash out. Because of the immutability and public visibility of the blockchain, the exposure of the first two stages will be inevitable. So the waterhouse manager will pass the funds to waterhouse mules composed of multiple unmarked addresses or the currency mixing service (Seres et al. 2019) before it is about to be tracked, in order to complete the transformation from pseudo-anonymity to true anonymity. The backhand of multiple unmarked addresses still has a certain potential for traceability, but once the currency mixing service is used, the currency flow will no longer be clear, and the difficulty of tracking and detection will be greatly increased.
The fourth stage is the Actions for Profit stage, the main goal of which is to cash out, that is, change from virtual currency to real fiat currency. In this stage, the attacker completes the cash out in different addresses of different exchanges by using decentralized exchange addresses, ending the entire attack chain.
According to our findings, between the third stage and the fourth stage, no matter what method is adopted in the third stage, the lateral transfer will eventually form a closed loop with the exchange or currency mixing service . After the closed loop with the exchange is formed, it is convenient to cash out. While after forming a closed loop with the currency mixing service, we could not find out whether the funds eventually flowed to the exchange because the subsequent addresses were difficult to trace. But according to our speculation, if the attacker wants to make a profit, she will eventually need to enter the exchange to cash out.
From the analysis of the four stages, we can infer that to detect and prevent malicious behavior in advance or to perform on-site restoration and tracking afterward, it is best to take action before the malicious chain has entered the mixing service or the exchange to cash out. It can reduce the difficulty of tracing and stopping losses.
Ethereum transactions scam behavior feature analysis
Through the analysis of normal addresses and abnormal addresses in the Ethereum token browser, according to their corresponding risk identification points, normal addresses can be divided into four categories, and abnormal addresses can be divided into two categories.
By comparing normal addresses and abnormal addresses with existing intelligence, the risk identification points that need to be investigated are active time span, day maximum balance, day transfers number, final balance, and the maximum daily balance minus minimum daily balances(in a time period with frequent transactions) divided by the number of the total transfers which representing average transaction volume in a period of time with frequent transactions. The comparison of risk identification points of various addresses is shown in Table 1, where BMax represents the maximum balance, BMin represents the minimum balance, and NT represents the total transfer number, in the period of time, respectively.
Normal addresses are divided into 4 categories according to risk identification points. The first category is large institutions, such as wallets, mining pools, and exchanges. Their active time span is usually very active, and transactions are being executed every day; although their daily maximum balance fluctuates, they are stable around a certain average value, and the amount of funds held is in M units. Although the number of daily transfers fluctuates, it is relatively stable, and there is no rise or disappearance in a short period of time, and the number of times is in units of thousands; \((BMax-BMin)/NT\) is also low, which means that the income and expenditure are basically balanced. It can reflect its characteristics as a trading platform, as shown in Fig. 10a.
The second is Ethereum tryers, such as those who have no prior financial knowledge but try to play coins. Their active time span usually spans the entire address life cycle, but the life cycle is usually only 3-4 months; their daily maximum balance is performed in units of thousands, and the amount of funds is relatively small. The number of daily transfers is not continuous, generally no more than 100 transactions per day; the amount of funds held in the balance is small, and it tends to transfer currencies only with a game mentality. \((BMax-BMin)/NT\) is slightly higher than that of stable large institutions, but it conforms to the discipline of normal transactions, as shown in Fig. 10b.
The third is people who are trying to make a profit with ether with some prior knowledge of finance and adopting financial activities. Its active time span is large, spanning the entire address life cycle. The life cycle is long, but generally shows great interest in the initial market entry stage and conducts multiple transactions, which only maintains occasional transactions as interest weakens in the later stage. The maximum daily balance is calculated in units of 10 thousand, but the fluctuation is large generally without intensive fluctuation. The number of daily transfers is not continuous and generally does not exceed 100 transactions per day. The balance shows that the amount of funds held is small so it also belongs to currency players. \((BMax-BMin)/NT\) conforms to the discipline of normal currency trading, as shown in Fig. 10c.
The fourth is Ethereum short-term holders. This type of address behaves differently from the second category. Although its active time span spans the entire address life cycle, its life cycle is very short, only 1-2 days. The daily highest balance is dominated by small amounts of funds, and the number of daily transfers is also dominated by single digits. The amount of the final balance is small. However, although this type of address is not marked as a malicious address, its behavior also conforms to the characteristics of the intermediate address used in the Lateral Transfer phase. So this type of address can also be classified as a suspicious address, as shown in Fig. 10d.
The abnormal addresses are divided into two categories according to risk identification points. The first is small malicious addresses (similar to thieves) that need to deal with a small amount of stolen money. Its active time span is similar to the second to fourth categories of normal addresses, but its daily maximum balance fluctuates greatly. After a period of time, continue to transfer funds, that is, the Lateral Transfer stage lasts for a long time so the amount of transferred assets is low. The number of daily transfers is small, in order to simulate normal address behavior to avoid detection. Its balance is generally cleared, which means all stolen funds have been cashed out. \((BMax-BMin)/NT\) is extremely high, and the balance generally decreases significantly within a few hours. The purpose is to quickly cash out and make a profit, as shown in Fig. 9a.
The second is large malicious addresses that need to deal with a large amount of stolen money (similar to the bandit). Its active time span and life cycle spanning the entire address are continuous and intensive. The daily maximum balance fluctuates greatly, showing a sudden increase in a short period and then a rapid and intensive decrease; the number of daily transfers occurs multiple times within a few hours but it is much smaller than the scale of the exchange, and there are intensive transfers for a period of time to complete large-scale cash out in a short period of time. Similarly, the balance is generally cleared to complete the cash out of all stolen funds, as shown in Fig. 9b.
Our investigation provides a fresh perspective on scam cybercrime research. In order to preserve a substantial amount of on-site data and intermediate chains related to malicious behavior, and leverage identified risk points for automatic detection of large-scale Ethereum scams, we propose a new solution. This solution involves designing an Ethereum transaction graph generation process based on the scam behavior, and utilizing a feature extraction algorithm. These approaches aim to retain malicious behavior data and detect abnormal behavior effectively on the Ethereum.
Problem statement
In this section, we present the detection problem and its relevant concepts.
Ethereum Transactions Network We model Ethereum transactions network as a graph \(G=(V_{all}, E_{all}, FN_{all},FE_{all})\), where \(V_{all}\) and \(E_{all}\) represent the whole set of nodes and edges on Ethereum respectively. \(FN_{all}\in \mathbb {R}^{|V_{all}|*d_1}\) and \(FE_{all}\in {\mathbb {R}}^{|E_{all}|*d_2}\) represent the matrix of nodes features and edges features respectively, where \(d_1\) and \(d_2\) is the dimension of features respectively.
Ethereum Transactions Graph Generation Problem Given the set of nodes \(V_{evil}\) and the Ethereum transactions network G, where \(V_{evil}\) represents the set of scam addresses that have been marked through various types of intelligence(Etherscan) (Cryptoscamdb)(Ethplorer). Our purpose is to extract the sub-graph \(G_{trans}=(V,E,FN,FE)\) adapting to our detection task. \(V = V_{evil}\cup V_{normal}\), where \(V_{normal}\) is the normal nodes set sampled from V. E is the edges set linked V. \(FN\in {\mathbb {R}}^{|V |*d_1}\) and \(FE\in {\mathbb {R}}^{|E|*d_2}\) represent the matrix of nodes features and edges features respectively, where \(d_1\) and \(d_2\) is the dimension of features respectively.
Although using the full amount of data on Ethereum can provide a comprehensive understanding of on-chain behavior, it will make difficulty to analyze sparse malicious behavior, and will also affect machine learning or deep learning models. Specifically, the full amount of data results in a high cost in computational consumption and training time of behavior mining. On the other hand, the full amount of data will increase the sparsity which may restricts models scalability. Therefore, before detecting and analyzing abnormal behaviors, by sampling the full amount of data, a transaction sub-graph that can reduce model computation should be constructed.
Ethereum Scam Behavior Detection Problem Given \(G_{trans}=(V,E,FN,FE)\), we are aimed to find the scam behavior nodes set \({\mathcal {V}}_s\subset V\). Label \(y\in \{0,1\}\) represent whether the node \(v\in V\) is scam or not. Our propose is given \(G_{trans}\) and the training set \(T=\{(v,y)\}\) then predict the scam probability \(Pr_{v_{test}}\) of testing set nodes \(v_{test}\).
The aparecium model
In this section we detail the Aparecium model. Firstly, we propose our graph generation method. Based on the graph embedding, then we propose a feature extraction method adapting with the risk identification points. Finally, we give the specific classification method using in our model. Figure 3 shows the overall flow chart of our detection method.

The flow chart of our detection method
Ethereum transactions graph generation based on the process of scam behavior
This section details our proposed algorithm. Taking \(V_{evil}\) as the center, the sub-graph derivation strategy is obtained by the characteristics summarizing from Section Behavior Investigation and Understanding. The schematic diagram of the graph generation process is shown in the overall flow chart. Its pseudocode is shown in Algorithm 1.
By comparing the scam intelligences (such as phishing, scamming, FakeICO, etc.) on Ethereum disclosed by Cryptoscamdb, Etherpoler, and Etherscan, if an address is marked as malicious by more than 2 of them, the address is selected as the central address for follow-up generation. All the above central addresses form the input \(V_{evil}\) of Algorithm 1. On lines 1-3, we initialize the transaction graph \(G_{trans}\), noting its nodes, edges, nodes features and edges features as (V, E, FN, FE) respectively. We add \(V_{evil}\) as the nodes’ initialization. Then we get features of \(v\in V\) by function \(get\_address\_node\_features\). On lines 4-10, we get all addresses matching the transactions from the central addresses set \(adrs_i\in V_{evil}\) as the first hop. Specifically, we first get transactions \(txs^0\) of \(adrs_i\) by the function \(get_txs\) and then merge all the addresses and edges with \(adrs_i\) in \(txs^0\) to set V and E respectively. Thirdly, add the matching edge features and node features in FE and FN by functions \(get\_address\_edge\_features\) and \(get\_address\_node\_features\), respectively. The central address nodes and the required transactions information form the seed dataset.
According to our research on scam behavior on Ethereum, we fix as many details and processes of scam behavior as possible in the dataset and finally form an extensive dataset. On lines 11-23, we generate the next hop of the graph, if a node \(txs_i^{step}.adrs\) reaches the exchange, currency mixing service, no follow-up out, or 10 hops have been performed in a certain hop, the graph generation stops. Otherwise, all nodes in the new hop become a new round of central addresses for follow-up generation (lines 16-20) whose functions are the same as those on lines 5-9. Finally, output the transaction graph \(G_{trans}\).

After the comparison, a total of 1,710 addresses were marked as malicious by more than 2 websites. Through the above generation method, 45,077 addresses that may be exploited (including the identified malicious addresses) were finally obtained. With the search and fixation of the process, at the same time, the pruning of massive Ethereum data has been completed too. As the number of \(V_{evil}\) and the \(max\_generate\_step\) are constant, our graph generation method can be completed in O(n) time which n presents the number of addresses in each step’s transactions.
Ethereum scam behavior feature extraction based on graph embedding
The ultimate goal of our proposed feature extraction method is to learn the node mapping function \(f: V\longrightarrow {\mathcal {E}}^{|V |*d}\), where \({\mathcal {E}}\) is the embedding space and d is the dimension of the embedding, to obtain the final node embedding. Inspired by the Skip-Gram model, we use stochastic gradient descent to maximize the likelihood function of the model, i.e. \(max_{f} \sum _{v\in V} log Pr\) \((Neighbor(v)\mid f(v))\), to get optimal mapping function. Due to the variety of scam behaviors on Ethereum, through the research and mining of disclosed intelligence, three major categories of characteristics need to be considered. The first is the network structure feature. We form the network structure feature with the node in-out ratio and maliciousness. The second is the pure semantic feature, formed by the cumulative transaction amount and the number of transactions. The third is the time mixed feature, formed by timestamp and naughty properties (detailed in the following). These three types of features can provide a more refined understanding of node behavior, paving the way for subsequent scam behavior detection.
Random Walks Given the current node v, obtain a sequence of nodes with a fixed length l, and select the next node n with:
where \(s_i\) represents the i-th node in the sequence, \(\pi _{vn}\) is the transition probability before normalization from the current node v to the next node n, and Z is the normalization constant.
Search Bias Although the popular node embedding algorithm Node2vec has a strong ability to express the local and global information of the network structure, for the Ethereum transaction network with hidden scam behavior, features such as the out-degree, in-degree, first-and-second-order neighbor nodes statement, transaction amount, number of transactions, timestamp, and turnovers changes are also very important. In order to ensure that more relevant features are retained in extraction, we design a biased random walk strategy based on the above three types of features which all in the time t (default \(t=1\) year).
Let v denote the current node, and \(Nbr_{v}\) denote the set of neighbor nodes of v.
-
(1)
Network Structure In-out ratio and Maliciousness
In-out ratio bias: After our manual analysis of the behaviors of disclosed malicious addresses, the analysis shows that the addresses used in malicious behaviors have a relatively unbalanced ratio of in- and out-degrees, which deviates greatly from normal transaction behaviors. Let the in-out degree ratio of a node be
$$\begin{aligned} D(v,n)=\left\{ \begin{aligned} n_{out},\ \ {}&if\ n_{in}=0\\ n_{in},\ \ {}&else\ if\ n_{out}=0\\ n_{in}/n_{out},\ \ {}&else\ if\ n_{in} \ge n_{out}\\ n_{out}/n_{in},\ \ {}&else\ if\ n_{in} < n_{out} \end{aligned} \right. \end{aligned}$$(2)where \(n\in Nbr_{v}\), \(n_{out}\) represents the out-degree of n, and \(n_{in}\) represents the in-degree of n. The transition probability from v to n is defined as
$$\begin{aligned} Pr_{D} = \frac{D(v,n)}{\sum _{n^{'}\in Nbr_{v}} D(v,n^{'})} \end{aligned}$$(3)Maliciousness bias: The analysis of scam behavior shows that it is generally difficult for a single address to complete the entire malicious behavior chain, and another malicious address is generally required at the first or second-order neighbor nodes in the chain. Therefore, we define the maliciousness of a node as
$$\begin{aligned} E(v,n)=\left\{ \begin{aligned} 2,\ \ {}&if\ EA\\ 1,\ \ {}&else\ if\ EB\\ 0,\ \ {}&otherwise \end{aligned} \right. \end{aligned}$$(4)where EA represents “n is scam” and EB represents “n is normal but its neighbors exist scam behaviors”. The transition probability from v to n is defined as
$$\begin{aligned} Pr_{E} = \frac{E(v,n)}{\sum _{n^{'}\in Nbr_{v}} E(v,n^{'})} \end{aligned}$$(5)Network Structure Bias Parameter \(\alpha\): To balance the two features used in the network structure, we define parameter \(\alpha\) (\(\alpha \in [0,1]\)). The unnormalized partial transition probability between v and n nodes defines as
$$\begin{aligned} \pi _{vn}(\alpha ) = Pr_{D}^{\alpha }\cdot Pr_{E}^{1-\alpha } \end{aligned}$$(6) -
(2)
Pure Semantic Amount and the number of transaction.
Amount bias: There is more than one transaction between two nodes. During the analysis of the transaction amount, we simply treat the transaction graph as an undirected graph, and take the total amount between the two nodes. Similar to traditional financial fraud, most scam behaviors involve the transfer of large funds. Let the total transaction amount between v and n be \(A(v,n)=\sum amount_t\),where \(amount_t\) is transition amount in period of time t, 1 year for default. The transition probability from v to n is defined as
$$\begin{aligned} Pr_{A} = \frac{A(v,n)}{\sum _{n^{'}\in Nbr_{v}} A(v,n^{'})} \end{aligned}$$(7)The number of transaction bias: In order to make profits as soon as possible and eliminate evidence, the number of transactions of scam addresses will increase significantly compared with normal addresses. Let the total number of transactions between v and v be R(v, n). The transition probability from v to n is defined as
$$\begin{aligned} Pr_{R} = \frac{R(v,n)}{\sum _{n^{'}\in Nbr_{v}} R(v,n^{'})} \end{aligned}$$(8)Pure Semantice Bias Parameter \(\beta\): To balance the two features used in the pure semantic, we define parameter \(\beta\) (\(\beta \in [0,1]\)). The unnormalized partial transition probability between v and n nodes defines as
$$\begin{aligned} \pi _{vn}(\beta ) = Pr_{A}^{\beta }\cdot Pr_{R}^{1-\beta } \end{aligned}$$(9) -
(3)
Time Mixed Timestamp and naughty.
Timestamp bias: Similar to the traditional case investigation, the transactions that occurred close to the median time of malicious activity by malicious nodes deserve our attention, so the time difference \(T(v,n) = |(timestamp_{vn}-Mid(timestamp_{vToAll}))|\). The transition probability from v to n is defined as
$$\begin{aligned} Pr_{T} = 1-\frac{T(v,n)}{\sum _{n^{'}\in Nbr_{v}} T(v,n^{'})} \end{aligned}$$(10)Naughty bias: In order to transfer the stolen funds quickly and covertly, the attacker usually adopts the transfer in multiple transactions to clear the balance in the malicious address. So we define an attribute that can reflect this behavior, named naughty, abbreviated as Nty,
$$\begin{aligned} Nty(u,x) = \frac{balance_{max}-balance_{min}}{\sum day\_trans\_num} \end{aligned}$$(11)where \(\sum day\_trans\_num\) corresponds to the total number of transactions used. The transition probability from v to n is defined as
$$\begin{aligned} Pr_{Nty} = \frac{Nty(v,n)}{\sum _{n^{'}\in Nbr_{v}} Nty(v,n^{'})} \end{aligned}$$(12)Time Mixed Bias Parameter \(\gamma\): To balance the two features used in the time mixed, we define parameter \(\gamma\) (\(\gamma \in [0,1]\)). The unnormalized partial transition probability between v and n nodes defines as
$$\begin{aligned} \pi _{vn}(\gamma ) = Pr_{T}^{\gamma }\cdot Pr_{Nty}^{1-\gamma } \end{aligned}$$(13)Combining the three parts of the transition probability, the final transition probability function between v and n nodes before normalization is obtained as
$$\begin{aligned} \pi _{vn}(\alpha ,\beta ,\gamma ) = (\pi _{vn}(\alpha )+ \pi _{vn}(\beta )+ \pi _{vn}(\gamma ))\cdot w \end{aligned}$$(14)where w is the original weight in the graph (if not exist, set it as 1).
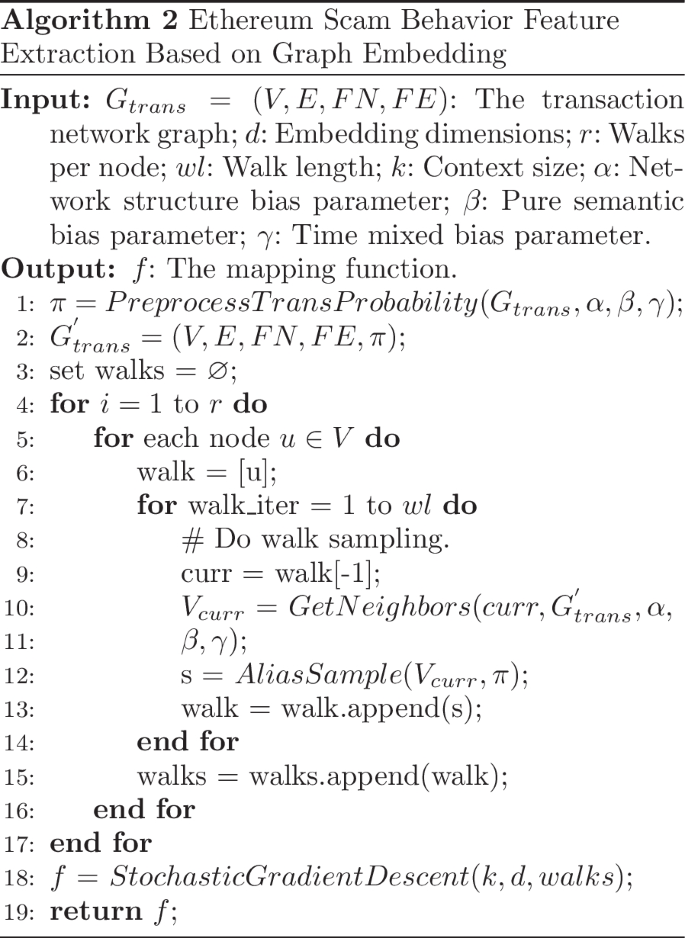
Embedding. By pre-computing \(\pi _{vn}\), a biased random walk sampling is performed to obtain the node sequence. Finally, the mapping function f is obtained by optimizing the stochastic gradient descent method to get node embedding features. The sampling process adopts the alias sampling technique, i.e., the feature extraction part can be completed in O(1) time. Its pseudocode is presented in Algorithm 2.
Specifically, on lines 1-3, we pre-compute the non-normalization transition probability \(\pi\) of each node in \(G_{trans}\) by the function PreprocessTransProba bility and then add \(\pi\) in the graph \(G_{trans}\) as a feature of edges. On lines 4-17, we iterate r times and each time, we conduct the proposed bias random walk methods on lines 7-14. The function GetNeighbors gets the neighbor nodes of the current node by the bias strategy and the function AliasSample is the Alias sampling method in which the probability distribution is \(\pi\). On lines 18-19, we optimize the mapping function f by stochastic gradient descent. Finally, we obtain the embedding mapping function f.

Ethereum scam behavior detection
Using the feature extraction method, we finally obtain the nodes embedding as features. Compared with the popular classification models, together with the raw features mentioned above, we feed the features into the random forest classifier. Given the ground truth label y and the combining features, through the bootstrap phase and the growing phase, finally we get the stable random forest(Breiman 2001).
Experiment
In this section, we show the experimental results of the above-proposed graph generation method and detection methods Aparecium. First, we demonstrate the superiority of the graph construction method by comparing the horizontal and vertical methods. Second, we conduct comparative experiments on detection schemes with multiple model comparisons. Finally, deploy Aparecium to Ethereum to discover new scam-relatively behaviors. The dataset is now open to https://drive.google.com/drive/folders/1Ap4sMsmg5pZZi-Y3_YWxhfl8ZhWzbcRn?usp=sharing.
Graph generation method evaluation
In this subsection, we conduct experiments on the Ethereum transaction subgraph obtained by the method described in Section The Aparecium Model. We use four popular feature extraction methods combined with the random forest classifier to detect scam behavior on Ethereum. At the same time, we compared four other popular Ethereum graph generation methods and found that the graph generation method proposed in this paper has stability and universality.
Baseline Methods For the node embedding method, we compared two kinds of graph representation learning methods and two kinds of graph deep learning methods to test the stability in the horizontal method, namely DeepWalk (Perozzi et al. 2014), node2vec (Grover and Leskovec 2016), GCN (Kipf and Welling 2016) and GraphSage (Hamilton et al. 2017). At present, the popular Ethereum graph generation methods can be divided into random time period-based, random address-based, and policy-based selective address graph generation methods. We compare these 3 types of methods to test the dominance of our methods over longitudinal methods.
Metrics We consider three evaluation metrics, namely precision, recall and F1-score. The three metrics are defined as follows:
where TP is true positive, FP is false positive and FN is false negative. The specific results are shown in Table 2.
Main Results (1) Compared with graph representation learning, the graph deep learning model has a stronger expressive ability, so the final result is slightly better than the two graph representation learning methods. But the results in the horizontal method are not much different so it proves the stability.
(2) For the graph generation method based on the random time period, all data from 2018.1 to 2020.5 were selected in the experiment. After simple noise processing, the proportion of abnormal nodes was only 0.059%. For the method based on random address, the experiment start from the 1165 source nodes including 1157 malicious nodes. 2,973,382 nodes were randomly crawled, and the proportion of abnormal nodes was only 0.038%. Since the downstream task is the anomaly detection task, these two types of methods do not perform graph pruning and imbalance processing at the construction level, so the final detection performance is not ideal.
(3) For policy-based selective addresses, two strategies are compared in the experiment. The first one contains 1259 phishing addresses, and 1259 normal addresses and first-order neighbor addresses are randomly selected, with a total of about 60,000 nodes and abnormal nodes. It accounts for 2.098%; the second type contains 1,000 phishing addresses, and randomly selects 1,000 normal addresses, a total of about 80,000 nodes, and abnormal nodes account for 1.250%. It can be seen that when abnormal nodes proportion increase, the final detection performance will also be further improved.
(4) Our method belongs to a strategy-based selective address graph generation method, with abnormal nodes accounting for 3.793% that the final detection performance has certain advantages. Under such a subgraph, the behavior and semantics of malicious nodes can be better learned. Also, the analysis and detection of malicious behaviors on Ethereum can be focused on.
Feature extraction method and classification model evaluation
Baseline Methods This paper proposes an embedding algorithm suitable for the detection of scam behavior in Ethereum. In order to reflect its advantages, we use other network embedding algorithms for comparison. Among them, DeepWalk and Node2vec are node embedding methods based on the walking strategy, in which DeepWalk is a random walk, and context learning is performed through co-occurred nodes. Node2vec is a biased walk, and node context learning is performed through the offset of local and global. Trans2vec is a biased walk for Ethereum’s phishing behavior. GraphSage and GCN are node embedding algorithms for deep neural networks and learn node context through the aggregation of neighbor features. T-EDGE (Lin et al. 2020b), I\(^2\)BGNN (Shen et al. 2021) and MCGC (Zhang et al. 2021) are detectors which dedicate to the Ethereum abnormal behavior detection.
Besides, we also compared the popular classification models which will impact the detection performance. We compared with logistic regression, isolate forest, support vector machine (SVM) and naive bayes under our feature extraction method.
Implementation Details To implement the above embedding algorithm, we use the following parameters. For the walk-based embedding algorithm, we set the following parameters: embedding dimension \(d=32\), length of walk \(l=7\), number of walks per node \(r=20\), context size \(k=9\). For node2vec, set \(p=0.75\), \(q=2\); for Trans2vec (Wu et al. 2020), set search bias parameter \(\alpha = 0.5\); for our proposed feature extraction part, set network structure bias parameter \(\alpha = 0.9\), pure semantic bias parameter \(\beta = 0.5\), time mixed bias parameter \(\gamma = 0.2\). For the neural network algorithm GraphSage and GCN, 2 layers of convolutional layers are set, the first layer uses 512 neurons, the second layer uses 256 neurons, the embedding size is 256 dimensions, the learning rate is 0.01, and the epoch is 40. For the detectors algorithm, we use the framework and optimal parameters detailed in their papers respectively.
The effects of embedding To highlight the significance of risk identification features, we conducted an experiment where we solely utilized these features for sampling without embedding. This approach was taken considering the bias inherent in our method. The experimental results, presented in Table 3, demonstrate the outcome of this analysis.
The effects of the risk identification features It can be seen from Table 3 that if the embedding algorithm is not used, the final detection effect of the scam behavior is not satisfactory. But from the results, it can be seen that the detection results are the best when all features are used, and the results of combined features are also significantly better than single features. The results show that not using graph structure information has a greater impact on the detection effect.
Main Results Table 4 shows the results after using the graph structure information, that is, the results after using the embedding algorithm. Table 5 shows the results about the classification models under our embedding algorithm.
-
(1)
The results show that our proposed algorithm is significantly higher than other methods in terms of F1-score and recall, but precision is slightly lower than GCN.
-
(2)
In addition, it can be seen that the results of network structure bias, pure semantic bias, and time mixed bias sampling are all higher than random walk sampling DeepWalk, which proves that the risk identification points we extracted can effectively describe the scam behavior in the Ethereum transaction network.
-
(3)
At the same time, the results in Tables 3 and 4 also show that the joint action of risk identification points and structural information can achieve the best scam behavior detection effect.
-
(4)
Besides, the results in Table 5 shows the performance of random forest is better than the other popular classifier. Thus, we select random forest for Aparecium.
Parameter analysis
For our proposed detection algorithm, there are many hyperparameters that will affect the final test result. Here we only show the changing trend of the hyperparameters that have a greater impact on the final scam behavior detection result. In the experiment, the control variable method is adopted, that is, when a parameter is changed in the experiment, the other parameters keep the default value.
Bias Parameter Firstly, as shown in Fig. 4, we explored the three offset parameters \(\alpha\), \(\beta\), \(\gamma\), and set each parameter from 0.1 to 0.9. For \(\alpha\), the trend of the three indicators is relatively stable, and the peak appears when \(\alpha =0.9\). This shows that the importance of the two identification points is not much difference between the in-out ratio and the maliciousness, and the in-out ratio is slightly more important. For \(\beta\), the trend of the three indicators is relatively flat, reaching a peak at 0.5. This shows that the transaction amount and the number of transactions are equally important, and both are indispensable. For \(\gamma\), the indicators fluctuated slightly, reaching their maximum value at 0.2. This shows that the naughty attribute we defined has a more important role than the timestamp.

Results of (a)–(c) bias parameters analysis
Other Hyperparameters We also experimented with various hyperparameters of the embedding method, as shown in Fig. 5. With the increase of embedding dimension d, the overall indicators show an upward trend, reaching a peak when \(d=32\), and decreasing slightly when \(d=64\). The reason may be that although the increase of dimension can carry more information, the original feature can basically describe the behavior pattern of the scam, so when d is too large, overfitting occurs. At the same time, we conducted experiments on the context size k from 1-11, and the peak was reached when \(k=9\). However, increasing wl did not make the indicators continue to rise, but decreased when \(wl=9\), because when wl continued to increase, a large number of subsequent sampling nodes were repeated, resulting in the inability to accurately describe the scam behavior. For the number of walks per node r, the larger the r, the higher the indicators, because the larger the r, the more information is collected for the neuron to learn.

Results of (a)–(d) hyperparameters analysis
Efficiency and scalability
Efficiency To evaluate the detection efficiency and scalability of our proposed method, the times are averaged after running the program 100 times. We first compared the embedding time and detection time of each method on the graph we constructed, as shown in Fig 6a. It can be seen from the figure that except for DeepWalk, which does not need to deal with node transition probability, the method proposed in this paper has the lowest embedding time and detection time. Combining with the comprehensive detection indicators show that our method has better detection efficiency.
Scalability In order to evaluate the scalability of the method, we conduct experiments on Erdos-Renyi(ER) random graphs using the tuned parameters, and the number of nodes is increased from 102 to 105. Since ER graph nodes cannot set feature values, Therefore, we set the features we used in our method to 1, which does not affect the detection of scalability. The scalability is shown in Fig. 6b. As the number of nodes increases, both the sampling time and the sampling + optimization time increase linearly. So this shows that our method can be applied to large-scale graph detection such as Ethereum.

Results of efficiency and scalability
Case study
The following is a detailed description of the abnormal behavior process by taking the two detected malicious behavior addresses as examples.

The chain of fakeICO behavior
Firstly, take a fakeICO address as an example, as shown in Fig. 7. After the fake advertising of the token issuance in the community (Bait Collection), a large number of funds flowed to this address (Trap Exploitation), after the financing was completed, it is shown from the figure that it did not carry out dividends as promised for investors. But directly transfer the currency obtained from financing to an address that has not been blacklisted (Lateral Transfer). At the same time, it can be seen from the figure that the transit address not only receives the funds of the Fake ICO address but also provides preparatory activities for the other two malicious behavior addresses before cashing out. But the exploitation address has not yet been marked as a malicious address. Then start to cash out (Actions for profit) through only one transit address, and finally cashed out through different addresses of different exchanges to diversify risks.

The key transaction flow diagram of the complex scam behavior chain
A more complex scam behavior chain is analyzed below, as shown in Fig. 8. Due to the complexity of the chain, we made a diagram of the flow of key transactions (removing small transactions such as transaction fees). Addresses starting with 0x...e6 employ contract exploitation and fake ICO methods to transfer funds, known as Bait Collection and Trap Exploitation. The funds are then dispersed among three addresses that are identified as malicious nodes. Among these addresses, 0x...b1 does not have any further outputs, while 0x...8e transfers a small amount of money to them. It is preliminarily determined that 0x...b1 addresses are obfuscated addresses that are obfuscated by malicious addresses to avoid tracing. After the 0x...6 address is transferred to 0x...19, the waterhouse mules addresses through the 2-4 steps will eventually form a closed loop (Lateral Transfer) with exchanges to complete the cash-out (Actions for profit). The large amount of funds transferred to the 0x...43 address is transferred through the 3-step whitelist address, and intensively enters the currency mixing protocol(Lateral Transfer) in a short period of time to resist tracing. While the remaining small amount of funds form a closed loop with the exchange and finally returned to the 0x...43 address to achieve the purpose of money laundering (Lateral Transfer). It completed the cash-out stage (Actions for profit) through the subsequent transactions with exchanges.
Conclusion
In this paper, we study the scam behavior on Ethereum. We propose a detection model named Aparecium to find the scam behavior based on the investigation and understanding for Ethereum. First, we found a unique and common life cycle of the scam behavior and the risk identification points for detection, attempting to break the antagonism. Then, the graph generation method based on the life cycle is utilized to mitigate the sparsity problem. Using bias random walking based on risk identification points and embedding technique, we dig the features of the scam behavior with crypticity. Finally, we use random forest for our classifier which show better performance under real Ethereum data and surpass other baseline methods. Due to the pluralistic reasons and features on Ethereum scam behaviors, e.g., crypticity, sparsity and antagonism, etc., understanding and designing appropriate detection models for it is intriguing.
Availability of data and materials
Not applicable.
References
Aggarwal CC et al (2015) Data mining: the textbook. Springer, Berlin
Alsulami H (2022) Implementation analysis of reliable unmanned aerial vehicles models for security against cyber-crimes: attacks, tracebacks, forensics and solutions. Comput Electr Eng 100:107870
Ao X, Liu Y, Qin Z, Sun Y, He Q (2021) Temporal high-order proximity aware behavior analysis on Ethereum. World Wide Web 5:1–21
Badari A, Chaudhury A (2021) An overview of bitcoin and Ethereum white-papers, forks, and prices. Forks Prices 2:58
BCSEC: BCSEC White Hat Security Institute. https://bcsec.org/
breadcrumbs: Breadcrumbs-Investigate the Blockchain. https://www.breadcrumbs.app/
Breiman L (2001) Random forests. Mach Learn 45:5–32
Chainanalysis: 2022 Crypto Crime Report. https://go.chainalysis.com/2022-Crypto-Crime-Report.html
Chen J, Xiong H, Zhang D, Liu Z, Wu J (2021) Tegdetector: a phishing detector that knows evolving transaction behaviors. arXiv preprint arXiv:2111.15446
Chen L, Peng J, Liu Y, Li J, Xie F, Zheng Z (2020) Phishing scams detection in Ethereum transaction network. ACM Trans Internet Technol (TOIT) 21(1):1–16
Chen L, Peng J, Liu Y, Li J, Xie F, Zheng Z (2020) Phishing scams detection in Ethereum transaction network. ACM Trans Internet Technol (TOIT) 21(1):1–16
Chen T, Li Z, Zhu Y, Chen J, Luo X, Lui JC-S, Lin X, Zhang X (2020) Understanding Ethereum via graph analysis. ACM Trans Internet Technol (TOIT) 20(2):1–32
Chen W, Zheng Z, Cui J, Ngai E, Zheng P, Zhou Y (2018) Detecting ponzi schemes on Ethereum: Towards healthier blockchain technology. In: Proceedings of the 2018 World Wide Web Conference, pp 1409–1418
Chhabra GS, Singh VP, Singh M (2020) Cyber forensics framework for big data analytics in IoT environment using machine learning. Multimedia Tools Appl 79:15881–15900
Cryptoscamdb: Cryptoscamdb open-source database. https://cryptoscamdb.org
Do Xuan C, Dao MH (2021) A novel approach for apt attack detection based on combined deep learning model. Neural Comput Appl 33:13251–13264
Ethereum: Ethereum security and scam prevention. https://Ethereum.org/en/security/
Etherscan: Etherscan. https://etherscan.io
Etherscan: Explore navigate Etherescan’s label world cloud. https://etherscan.io/labelcloud
Ethplorer: Ethpoler-Ethereum explorer. https://ethplorer.io
Grover A, Leskovec J (2016) node2vec: Scalable feature learning for networks. In: Proceedings of the 22nd ACM SIGKDD International Conference on Knowledge Discovery and Data Mining, pp 855–864
Hamilton W, Ying Z, Leskovec J (2017) Inductive representation learning on large graphs. In: Advances in neural information processing systems, vol 30
Hu Y, Seneviratne S, Thilakarathna K, Fukuda K, Seneviratne A (2019) Characterizing and detecting money laundering activities on the bitcoin network. arXiv preprint arXiv:1912.12060
Huang T, Lin D, Wu J (2022) Ethereum account classification based on graph convolutional network. IEEE Trans Circuits Syst II Express Briefs 69(5):2528–2532
Iansiti M, Lakhani KR et al (2017) The truth about blockchain. Harv Bus Rev 95(1):118–127
Irshad H, Ciocarlie G, Gehani A, Yegneswaran V, Lee KH, Patel J, Jha S, Kwon Y, Xu D, Zhang X (2021) Trace: Enterprise-wide provenance tracking for real-time apt detection. IEEE Trans Inf Forensics Secur 16:4363–4376
Jin C, Jin J, Zhou J, Wu J, Xuan Q (2022) Heterogeneous feature augmentation for ponzi detection in Ethereum. IEEE Trans Circuits Syst II Express Briefs 69(9):3919–3923
Kipf TN, Welling M (2016) Semi-supervised classification with graph convolutional networks. arXiv preprint arXiv:1609.02907
Li S, Xu F, Wang R, Zhong S (2021) Self-supervised incremental deep graph learning for Ethereum phishing scam detection. arXiv preprint arXiv:2106.10176
Lin D, Wu J, Yuan Q, Zheng Z (2020) Modeling and understanding Ethereum transaction records via a complex network approach. IEEE Trans Circuits Syst II Express Briefs 67(11):2737–2741
Lin D, Wu J, Yuan Q, Zheng Z (2020) T-edge: temporal weighted multidigraph embedding for Ethereum transaction network analysis. Front Phys 8:204
Manoj SKA, Bhaskari DL (2016) Cloud forensics-a framework for investigating cyber attacks in cloud environment. Procedia Comput Sci 85:149–154
Monamo P, Marivate V, Twala B (2016) Unsupervised learning for robust bitcoin fraud detection. In: 2016 Information Security for South Africa (ISSA), pp 129–134. IEEE
MURPHY C (xxxx) Beware of Cryptocurrency Scams. https://www.investopedia.com/articles/forex/042315/beware-these-five-bitcoin-scams.asp
Ostapowicz M, Żbikowski K (2019a) Detecting fraudulent accounts on blockchain: a supervised approach. In: Web Information Systems Engineering–WISE 2019: 20th International Conference, Hong Kong, China, January 19–22, 2020, Proceedings 20, pp 18–31. Springer
Ostapowicz M, Żbikowski K (2019b) Detecting fraudulent accounts on blockchain: a supervised approach. In: Web Information Systems Engineering–WISE 2019: 20th International Conference, Hong Kong, China, January 19–22, 2020, Proceedings 20, pp 18–31. Springer
Patel V, Pan L, Rajasegarar S (2020a) Graph deep learning based anomaly detection in Ethereum blockchain network. In: Network and System Security: 14th International Conference, NSS 2020, Melbourne, VIC, Australia, November 25–27, 2020, Proceedings 14, pp 132–148. Springer
Patel V, Pan L, Rajasegarar S (2020b) Graph deep learning based anomaly detection in Ethereum blockchain network. In: Network and System Security: 14th International Conference, NSS 2020, Melbourne, VIC, Australia, November 25–27, 2020, Proceedings 14, pp 132–148. Springer
Perozzi B, Al-Rfou R, Skiena S (2014) Deepwalk: Online learning of social representations. In: Proceedings of the 20th ACM SIGKDD International Conference on Knowledge Discovery and Data Mining, pp 701–710
Pham T, Lee S (2016) Anomaly detection in bitcoin network using unsupervised learning methods. arXiv preprint arXiv:1611.03941
Ron D, Shamir A (2013) Quantitative analysis of the full bitcoin transaction graph. In: Financial Cryptography and Data Security: 17th International Conference, FC 2013, Okinawa, Japan, April 1–5, 2013, Revised Selected Papers 17, pp 6–24. Springer
Sayadi S, Rejeb SB, Choukair Z (2019) Anomaly detection model over blockchain electronic transactions. In: 2019 15th International Wireless Communications & Mobile Computing Conference (IWCMC), pp 895–900 . IEEE
Seres IA, Nagy DA, Buckland C, Burcsi P (2019) Mixeth: efficient, trustless coin mixing service for Ethereum. Cryptology ePrint Arch 2:966
Shen J, Zhou J, Xie Y, Yu S, Xuan Q (2021) Identity inference on blockchain using graph neural network. In: Blockchain and Trustworthy Systems: Third International Conference, BlockSys 2021, Guangzhou, China, August 5–6, 2021, Revised Selected Papers 3, pp 3–17. Springer
Su L, Shen X, Du X, Liao X, Wang X, Xing L, Liu B (2021) Evil under the sun: Understanding and discovering attacks on Ethereum decentralized applications. In: USENIX Security Symposium, pp 1307–1324
Tang J, Qu M, Wang M, Zhang M, Yan J, Mei Q (2015) Line: Large-scale information network embedding. In: Proceedings of the 24th International Conference on World Wide Web, pp 1067–1077
Weber M, Domeniconi G, Chen J, Weidele DKI, Bellei C, Robinson T, Leiserson CE (2019) Anti-money laundering in bitcoin: Experimenting with graph convolutional networks for financial forensics. arXiv preprint arXiv:1908.02591
Wu J, Yuan Q, Lin D, You W, Chen W, Chen C, Zheng Z (2020) Who are the phishers? phishing scam detection on Ethereum via network embedding. IEEE Transactions on Systems, Man, and Cybernetics: Systems 52(2):1156–1166
Yu K, Tan L, Mumtaz S, Al-Rubaye S, Al-Dulaimi A, Bashir AK, Khan FA (2021) Securing critical infrastructures: deep-learning-based threat detection in iiot. IEEE Commun Mag 59(10):76–82
Yu S, Jin J, Xie Y, Shen J, Xuan Q (2021b) Ponzi scheme detection in Ethereum transaction network. In: Blockchain and Trustworthy Systems: Third International Conference, BlockSys 2021, Guangzhou, China, August 5–6, 2021, Revised Selected Papers 3, pp. 175–186. Springer
Yuan Q, Huang B, Zhang J, Wu J, Zhang H, Zhang X (2020) Detecting phishing scams on Ethereum based on transaction records. In: 2020 IEEE International Symposium on Circuits and Systems (ISCAS), pp. 1–5. IEEE
Yuan Y, Wang F-Y (2018) Blockchain and cryptocurrencies: Model, techniques, and applications. IEEE Transactions on Systems, Man, and Cybernetics: Systems 48(9):1421–1428
Zhang D, Chen J, Lu X (2021) Blockchain phishing scam detection via multi-channel graph classification. In: Blockchain and Trustworthy Systems: Third International Conference, BlockSys 2021, Guangzhou, China, August 5–6, 2021, Revised Selected Papers 3, pp. 241–256. Springer
Zhou H, Sun G, Fu S, Wang L, Hu J, Gao Y (2021) Internet financial fraud detection based on a distributed big data approach with node2vec. IEEE Access 9:43378–43386
Acknowledgements
We are deeply grateful to the blind peer reviewers for their valuable suggestions and feedback on our paper. Their contributions have significantly enhanced the quality of our research. We would also like to extend our gratitude to all those who have provided assistance and support throughout the development of this paper.
Funding
This research is supported by National Key Research and Development Program of China (No.2021YFF0307203, No.2019QY1300), Youth Innovation Promotion Association CAS (No.2021156), the Strategic Priority Research Program of Chinese Academy of Sciences (No.XDC02040100) and National Natural Science Foundation of China (No.61802404). This work is also supported by the Program of Key Laboratory of Network Assessment Technology, the Chinese Academy of Sciences, Program of Beijing Key Laboratory of Network Security and Protection Technology.
Author information
Authors and Affiliations
Contributions
All authors have contributed to this manuscript and approve of this submission. CY participated in all the work and drafting the article. JL and YQ participated in the baseline experiments and dataset construction. CZ did some basic collection work. Prof. YL, ZL, NL and MS made a decisive contribution to the content of research and revising the article critically.
Corresponding author
Ethics declarations
Competing interests
The authors declare that they have no competing interests.
Additional information
Publisher’s Note
Springer Nature remains neutral with regard to jurisdictional claims in published maps and institutional affiliations.
Appendix A: Risk identification points performance
Appendix A: Risk identification points performance
This section shows the risk identification points performance graphic of normal addresses and scam addresses in Figs. 9 and 10.

Risk identification points performance for scam addresses: a Theif; b Bandit

Risk identification points performance for normal addresses: a Large institutions; b Ethereum tryer; c Ethereum speculators; d Ethereum short-term holders
Rights and permissions
Open Access This article is licensed under a Creative Commons Attribution 4.0 International License, which permits use, sharing, adaptation, distribution and reproduction in any medium or format, as long as you give appropriate credit to the original author(s) and the source, provide a link to the Creative Commons licence, and indicate if changes were made. The images or other third party material in this article are included in the article's Creative Commons licence, unless indicated otherwise in a credit line to the material. If material is not included in the article's Creative Commons licence and your intended use is not permitted by statutory regulation or exceeds the permitted use, you will need to obtain permission directly from the copyright holder. To view a copy of this licence, visit http://creativecommons.org/licenses/by/4.0/.
About this article

Cite this article
Yan, C., Zhang, C., Shen, M. et al. Aparecium: understanding and detecting scam behaviors on Ethereum via biased random walk. Cybersecurity 6, 46 (2023). https://doi.org/10.1186/s42400-023-00180-x
Received:
Accepted:
Published:
DOI: https://doi.org/10.1186/s42400-023-00180-x