- Survey
- Open access
- Published:
Evaluation indicators for open-source software: a review
Cybersecurity volume 4, Article number: 20 (2021)
Abstract
In recent years, the widespread applications of open-source software (OSS) have brought great convenience for software developers. However, it is always facing unavoidable security risks, such as open-source code defects and security vulnerabilities. To find out the OSS risks in time, we carry out an empirical study to identify the indicators for evaluating the OSS. To achieve a comprehensive understanding of the OSS assessment, we collect 56 papers from prestigious academic venues (such as IEEE Xplore, ACM Digital Library, DBLP, and Google Scholar) in the past 21 years. During the process of the investigation, we first identify the main concerns for selecting OSS and distill five types of commonly used indicators to assess OSS. We then conduct a comparative analysis to discuss how these indicators are used in each surveyed study and their differences. Moreover, we further undertake a correlation analysis between these indicators and uncover 13 confirmed conclusions and four cases with controversy occurring in these studies. Finally, we discuss several possible applications of these conclusions, which are insightful for the research on OSS and software supply chain.
Introduction
The ever-increasing complexity of modern software makes software development difficult and error-prone. Modular programming is proposed to ease software development and gain momentum in recent years. Generally, to build a software system, one developer only needs to implement the primary module and invoke open-source software (OSS) for non-primary modules (Huang et al. 2006). Although OSS offers great convenience for rapid development, it brings several unpredictable issues, such as security risks (Silic and Back 2016), copyleft disputes (Kennedy 2001), and compatibility issues (Gordon 2011). These issues have recently drawn the attention of both researchers and practitioners. For example, the US Department of Homeland Security funded Coverity to design Coverity Scan to analyze the quality and security of OSS. According to the latest Coverity Scan Report, as of February 2017, Coverity Scan has tested more than 7,000 various OSS projects and found a large number of defects at the source code level (Coverity Scan-Open Source Report 2017). The abuse of open-source code has caused numerous code defects and vulnerabilities (Hoepman and Jacobs 2007), which can not only destroy code quality and performance but also bring issues like license infringement (Schryen and Kadura 2009).
Motivation. Prior studies analyzed how to evaluate OSS (Crowston et al. 2004; Sen 2006; Fershtman and Gandal 2004; Ghapanchi 2015). They proposed various indicators for evaluating OSS. However, since there is no uniform definition of success or performance, their studies usually use different indicators to evaluate OSS. Alternatively, they used quantitative evaluation indicators as evaluation criteria, which is the main reason for conclusion conflicts in prior studies. Moreover, their studies do not analyze the importance of various indicators. Some indicator definitions are relatively abstract, so different studies have different quantitative standards for them. Therefore, a systematic and credible evaluation structure for OSS is urgently needed.
The data used in prior studies to evaluate OSS are mostly collected from the open-source community at a single time point. Usually, the OSS developers are voluntary and obligated to fix bugs or update a new version. Therefore, time has greater influence on OSS than closed source software. Regardless of the time, the data collected may not fully reflect the overall status of OSS. Therefore, choosing a time node has become a critical but difficult point. For OSS that has been released for several years, need it collect data from the beginning? How often is the best update frequency for users? How the stable status influence users and developers? These problems need to be resolved through a more detailed analysis.
Finally, there is no systematic statistical analysis to investigate the correlations between these indicators. The correlation between indicators is generally only reflected as additional content in previous studies. However, understanding the correlation between different indicators is conducive to making a targeted modification to improve user experience. Therefore, we summarize and collate the correlations between the indicators presented in the previous studies, and further identify more correlations to guide the evaluation of OSS projects.
Our Approach. We investigate 56 papers from 1999 to 2020. In these studies, the indicators designed for OSS and the quantification method for each indicator are also slightly different. We classify these indicators into five types, code, license, popularity, developer, and sponsorship. Among these five types, code includes several aspects, such as vulnerability, source risk, and reusability; Popularity includes market penetration and user interest; Developer includes reliability, project activity, developer number, and the corresponding contribution. Subsequently, we perform a correlation analysis on these indicators and then identify how one indicator influences another indicator.
Findings. The main findings of our empirical study can be summarized as follows:
-
Confirmed correlations. The correlation between some indicators has been recognized by several arguments. In particular, project status, age, activity, copyleft, and developer interest will promote its popularity. A license will reduce its popularity. Copyleft and sponsor can promote project activity. Moreover, copyleft has a positive influence on the number of developers. Finally, OSS can positively influence the popularity and developer interest in a Unix-like operating system.
-
Controversial correlations. Different studies may adopt different approaches and experimental data sets, so that the correlation value calculated by the approach may be different. As a result, their conclusions may be inconsistent in some cases. For example, user interest and Unix-like operating systems have an extreme correlation with project activity. Moreover, whether a license or program language correlates with project status and popularity is unclear. One proposed they are independent (Lerner and Tirole 2005), but the other argued there is a positive correlation (Comino et al. 2007).
-
Newly-found correlations. There are still some correlations between indicators that have not been explored in prior studies. We use a directive graph and transitive law to indicate possible correlations. For example, copyleft, sponsor, and Unix-like operating system may promote the project status.
Contributions. The contributions of this paper are outlined as follows:
-
Survey OSS evaluation. We conduct an in-depth survey of the previous studies for 56 papers and classify their indicators into five types manually. For each type, we summarize its sub-type indicators and the correlation of these indicators found in the previous studies. This will be a leading for others to evaluate and choose the OSS in future.
-
New findings. We find the co-certified and opposite conclusions in previous studies. Since correlations between some sub-type indicators in the previous studies have not been analyzed, we also give our conjecture.
The rest of the paper is organized as follows: “Related work” section briefly describes the related studies on OSS assessment and existing evaluation methods. “Overview” section shows the overall research framework. “Evaluation indicators” section summarizes the indicators proposed by previous studies and their corresponding meanings. “Correlation analysis” section shows the statistics of the correlation among these indicators by plotting charts. “Discussion” section discusses the strength and the weakness of our empirical study, and “Conclusion” section concludes this paper.
Related work
Assessment of OSS success
Open source is of great importance for its economic and time-to-market advantages. The success of OSS is an essential measurement for choosing appropriate projects in the repositories. However, there are only a few reviews on OSS success evaluation. Alireza et al. (2014) summed up 23 papers on OSS success evaluation. Then they summarized commonly used indicators. However, they did not mention the correlation among indicators. Moreover, the collection of related papers seemed incomplete. Margan and Čandrlić (2015) summarized the reason and history for OSS’s success. Then they analyzed the quality and success criteria. Their work only enumerated prior studies about OSS success, but they had not analyzed these studies’ differences. The study of Gezici et al. (2019) is the closest to our work. They surveyed the relation of quality and success of OSS. In particular, they used a systematic mapping to categorize existing studies into five parts based on research questions, contribution and research types, quality criteria and metrics, success criteria and metrics, the relation of quality and success, and demographics. In the part of the success criteria and metrics, they analyzed the indicators used to evaluate OSS. Their study’s focus is to analyze the relationship between the quality indicator and success indicator in prior studies, which indicators are commonly used to analyze success indicators, and the indicators most frequently used to measure success. However, we mainly focus on exploring the indicators related to OSS’s success in prior studies and their correlation.
Evaluation perspective and typical evaluation methods for OSS
Although there may be few surveys on OSS success, many organizations, companies as well as individuals have adopted evaluation methods along with their specific needs to determine which software to use. According to user classification, the OSS evaluation can be generally divided into three perspectives: user, developer, and tester (Cheng and Guo 2019; Yuan et al. 2010). In particular, due to prior works and our research on employees from one famous company, users generally choose OSS that meets their functional requirements. Moreover, the chosen OSS must be of good quality and within the scope of license for further development or modification (?{33-lerner2005scope}). Developers generally develop their own software that meets their requirements and exist little or no license risk (Lerner and Tirole 2005; Fershtman and Gandal 2004). Tester is generally a third party, mainly testing whether OSS has a significant impact on company and society (Yuan et al. 2010).
According to different concerns, a common evaluation perspective can be divided into four indicators: quality, maturity, reliability and vulnerability.
Quality
Generally speaking, software quality (Aberdour 2007) mainly refers to software’s ability to meet users’ needs or comprehensive expectations in use. For the quality evaluation of OSS, current influential evaluation models are the Open Source Maturity Model (OSMM) (Golden 2008), OpenBRR model (Wasserman et al. 2006), and QSOS model (Semeteys 2008). The QSOS model’s complexity is the highest, while the OSMM model’s complexity is the lowest. In addition, there is another quality evaluation model SQO-OSS (Samoladas et al. 2008) for OSS, which can continuously evaluate a system by considering the open-source community.
Maturity
Software maturity (Petrinja et al. 2009) mainly refers to technical characteristics or application characteristics that can be achieved by OSS. It needs to consider general quality characteristics and the uniqueness in development or business model. At present, a variety of models have been proposed for the maturity evaluation, such as Capability Maturity Model (CMM) (Paulk et al. 1993), Open-Source Maturity Model (OMM) (Petrinja et al. 2009) that is similar to CMM but aims at OSS, the QualiPSo (del Bianco et al. 2009) maturity model and a model (Kuwata et al. 2014) based on OSS community to evaluate products.
Vulnerability
Software vulnerabilities are essentially the existence of defects in software (Wolf et al. 2013). When evaluating the vulnerability of OSS, it is usually analyzed from the source of the vulnerability, the component it belongs to, the components that the vulnerability impacts, and the degree of the vulnerability impacts. Common evaluation methods can be divided into three types: static analysis methods (Erturk 2012), dynamic analysis methods, and cross-type analysis methods (Aggarwal and Jalote 2006).
Reliability
The reliability of OSS mainly examines the probability that OSS can maintain unobstructed operation in the prescribed tests. Cristescu and Cristescu (2009) systematically introduced software reliability, the method of judging reliability, and a possible method of establishing a reliability model. Zhu and Pham (2018) developed a reliability model for multi-release software, which is used to detect legacy faults, newly introduced faults, and related faults detection processes. Yang et al. (2016) established a framework for multi-version software reliability modeling and considered the delay of the patch, which is similar to that of Zhu and Pham (2018), but the model is upgraded. Moreover, it fully illustrated the necessity and importance of reliability analysis.
Overview
Target
OSS has a significant impact on the software fields (Bretthauer 2001). Although it brings great convenience, improper citation methods may bring problems. Prior studies proposed the indicators from different perspectives to measure OSS. However, there is no survey work for summarizing these evaluation indicators. Therefore, the targets of this paper can be summarized as follows:
-
The first target is to analyze the evaluation indicators of OSS in the previous studies comprehensively;
-
The second target is to compare similarities or differences of conclusions for each study, and analyze specific reasons for controversial conclusions;
-
Based on predecessors’ conclusions, combined with current using status of OSS, the third target is to point out some research aspects still need to be carried out.
Our approach
We collect 56 papers about OSS and its evaluation indicators from online scholar search engines, such as IEEE Xplore, ACM Digital Library, DBLP, and Google Scholar. Then we find that 42 of them proposed the methods to evaluate OSS, 34 of them analyzed the correlation of specific indicators, and others discussed how indicators affect OSS. We ask four members to read and analyze all these papers and summarize their conclusions in the table. Unfortunately, we did not conduct a cross-check since the data sets of prior studies were collected in different years. Therefore, we only compare the conclusions of each work theoretically. We orthogonally separate the indicators we found in the related studies and obtain five uncorrelated evaluation indicators, which are code, license, developer, popularity, and sponsorship. After that, we summarize the correlation between the various sub-indicators and summarize some findings. The process is shown in Fig. 1.

The overview of our methodology
Paper collection. We collect papers by using keywords from the popular scholar search engines as mentioned above and from the related studies in the gathered papers. The chosen keywords are “OSS”, “open source software”, “success” and “performance”. We classify them into two groups. In these groups, group A contains “OSS” and “open-source software”, group B contains “success” and “performance”. There are so many matches, but most of these do not meet our requirements. After filtrating, we find a total of 79 prior studies. Then, we read the abstract of these papers and identified whether its content is related to OSS success. After reading its contents, we find 23 studies did not mention specific evaluation methods or the correlation between indicators. They only discussed the success of an open-source community or a single open-source project. Therefore, the remaining 56 studies are what we need. Based on their contents, we summarize prior studies’ evaluation methods. These studies also analyze the influence of one indicator on OSS and the correlation between indicators.
Indicator Identification. As mentioned above, we summarize the data sets and approach used in previous studies in Table 1. From Table 1, most of the experimental data came from two open-source communities of SourceForgeFootnote 1, FreshMeatFootnote 2 and githubFootnote 3, and a small part of the data came from other websites, such as MeanoFootnote 4 and OpenMokoFootnote 5, and DebianFootnote 6. At present, Github has achieved excellent application results, with 9 million developer users. Due to the widespread usage of the cloud in recent years, Github has an advantage over the previous ones because developers can use a fork to contribute code more easily. According to our investigation, FreshMeat has been merged with SourceForge. Moreover, the use of SourceForge has shown a slight declination. Therefore, in the future work, if there is an analysis of OSS attributes, the data set used is more likely to come from the Github website. In prior studies, the most used evaluation approach is the regression method. It can be used for analyzing the correlation for specific indicators. Ordinary least squares regression (OLS) (Legendre 1806) is the most basic method in regression analysis. It has the least requirements for model conditions and is also the most frequently used in the process of statistical analysis. Generalized Least Squares (GLS) (Aitken 1936) is a generic form of OLS. The difference between them is that OLS assumes the residuals are homoscedasticity, while GLS can be used to eliminate heteroscedasticity. The two-stage least squares method (2SLS) (James and Singh 1978) is used to test regression models with endogenous variables. The difference between 2SLS and OLS is that OLS guarantees minimum variance while 2SLS guarantees consistent estimates. The three-stage least squares method (3SLS) (Zellner and Theil 1962) is the extension of 2SLS. By using all the information, 3SLS pays attention to the simultaneous correlation of each equation’s random perturbation terms in the model. Besides the regression method, there are some other data analysis approaches. Latent class cluster analysis (LCA) (Andersen 1982) is a technique for finding subtypes in multivariate classification data. Atlas-tiFootnote 7 is a mature work platform, mainly used for all kinds of data analysis. The tool is easy to use, and the calculation is accurate. Abductive approach (Abductive Inference 1994) is also called abductive reasoning, which is a method that generalizes reasonable individual things to general things and obtains certain principles or rules. Theory-driven approach (Chen and Rossi 1983) is often used to measure the validity of a specific method. Principal component analysis (PCA) (Karl Pearson 1901) is the simplest method to analyze multivariate statistical distribution by using characteristic quantities, and it is generally used to reveal data internal structure. Inferential statistics (Lowry 2008) makes an informed inference of the overall data and information based on the sample data and information. Six-vertex measurement model (Robinson and Vlas 2015) is a method proposed by the authors to solve the requirements problem. They also demonstrate its feasibility in the previous study. Wilcoxon rank-sum test (Wilcoxon 1945) uses the sign and size information of the difference between the observed value and the center position of the null hypothesis to test. Its effect is better than the sign test. Bonferroni correction (Dunnett 1955) is often used in multiple comparisons, which can correct familywise error rate conservatively.
The evaluation of OSS in prior studies can be summarized in Table 2. The data is collected from the papers about success indicators mentioned above. From Table 2, they can be divided into four categories: code, license, developer, and popularity. Coupled with the unique attributes of OSS, sponsorship, they constitute a five-dimensional indicator to measure OSS together. Next, we analyze their impact on OSS. As we can see, the authors used more static data in earlier works. With the continuous deepening of research, researchers found only using the data at a single point for analysis obviously cannot meet the accuracy required. For the first time, Garousi (2009) used dynamic indicators to evaluate four systematically-sampled OSS projects. They obtained data across the project’s lifetime about three indicators: developer number, download number, and bug-fixing performance. Apparently, dynamic data is more convincing than static data. Therefore, there are some studies after Garousi using dynamic indicators to perform data collection and experimental analysis. What’s more, the indicators in earlier works are more possible to evaluate the attributes of projects or something influencing users’ choice. Since 2011, these indicators have focused more on the impact of developers on the overall project, in particular, developers capability, developers interest, etc.
Correlation Analysis. We summarize all the conclusions in the studies discussing the correlation between indicators. And we show these indicators and correlations via a directed figure, which is shown in Fig. 2. From this figure, we can find the correlation of some indicators remains unknown, such as the correlation of project status and popularity, the correlation of project age and activity. However, we can use a transitive relation to analyze these possible correlations.
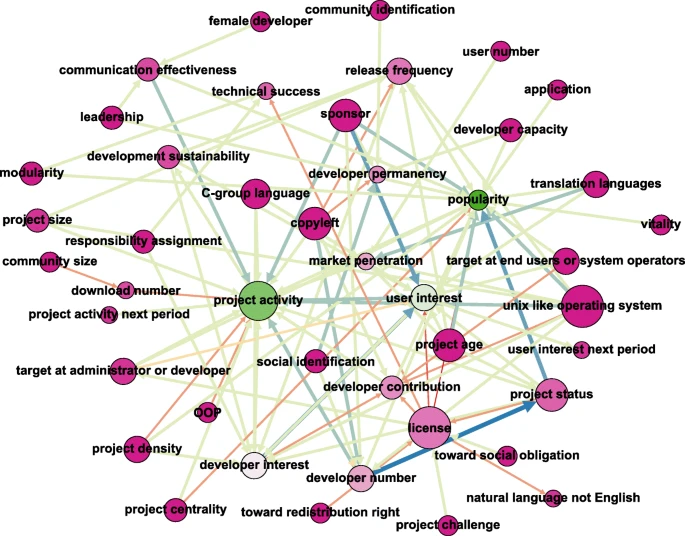
This is the correlation between the indicators evaluated above. The color of one node represents the out-degree of the node, and the size of one node represents the in-degree of the node. Out-degree indicates the number of edges connected from a node. In-degree indicates the number of edges attached to a node. The color of the node transforms from dark pink to white and even to green. The heavier the pink of the node, the lower its in-degree. And, the heavier the green of the node, the higher its in-degree. What’s more, the larger the size of the node, the higher its out-degree. There are also different colors of edges, such as yellow, orange, and blue. The color of the edge depends on the weight of the correlation of two nodes. If the correlation is a positive impact, the color of the edge is a warm color; Otherwise, the color is a cold color
Evaluation indicators
Based on the above analysis, most of the evaluation indicators in the prior studies are not comprehensive. Therefore, we show the definition of indicators for OSS success. OSS success means OSS does not cause problems in other areas while meeting users’ functional needs. These problems include security issues, license misusing issues, and program errors or crashes issues. Obviously, frequent program errors and crashes can affect both users and developers of the project.
Code
Code (i.e., source code) is the carrier of functions for a system, and its quality is highly dependent on developers’ experience and abilities (Foolbox Native 2020). Therefore in this study, we take into account three aspects for code: vulnerability, source risk, and reusability.
Vulnerability
There are many types of definitions for vulnerability (Wolf et al. 2013; Brooks 2003; Ezell 2010). We combine these viewpoints and regard it as computer security flaws or weaknesses that can cause serious consequences. Vulnerability threatens confidentiality, integrity, availability, access control, and monitoring mechanisms of the system or its application data. If a project has many vulnerabilities, it has a significant risk of incorporating it into your project. Frei et al. (2006) analyzed a dataset with more than 14,000 vulnerabilities, studied how to patch on a large scale vulnerabilities, and provided valuable suggestions for security investment decisions. Mell et al. (2006) introduced how the Common Vulnerability Scoring System (CVSS) judged the severity of a vulnerability. In their study, its indicators were used to examine the performance of OSS vulnerabilities. Marconato et al. (Marconato et al. 2012) analyzed the vulnerability cycle of various platforms and found the disclosure in Windows platform had been delayed as far as possible until patch releases. As a result, it becomes critical whether the bug in OSS has been fixed. Vulnerability rating is usually quantified by the Common Vulnerability Scoring System (CVSS) (Mell et al. 2007). It is composed of three metric groups: Base, Temporal and Environmental. This method is designed for characterizing vulnerabilities and providing users with a concise vulnerability awareness. Houmb et al. (2010) used CVSS and Bayesian Belief Network (BBN) (Jensen 1996) to quantitatively estimate the security risk of a system or a specific part of the system, where CVSS is used to build the model and its value is input for running the BBN model. They reorganized CVSS metrics to evaluate the performance of a system. The new CVSS outputs the frequency and impact of vulnerability instead of vulnerability severity level. This work can also be applied to OSS to assess the impact of vulnerabilities on security performance. Notice this study did not mention how to analyze the data when there are multiple vulnerabilities in the system. Lin et al. (2008) used CVSS to measure the severity of an organization’s vulnerability. Compared with vulnerability assessment tools, they added manually imported system features to generate environment and time scores. The problem of their study is that only one vulnerability assessment can be completed.
Access source
Access source refers to the channels from developers to suppliers and from suppliers to users (Boehmke and Hazen 2017). Attackers can use attack methods for each part of the software life cycle to implant a backdoor or Trojan to achieve their intended purposes. Boehmke and Hazen (2017) proposed that OSS was widely used and had the potential to change the supply chain information system. Therefore, when considering the choice of OSS, its access source should be well evaluated to ensure availability. Ellison and Woody (2010) analyzed the components of software supply chain risk and analysis methods to reduce the possibility of vulnerabilities in purchased software elaborately. Levy (2003) analyzed how OSS and proprietary software brought in risk.
Software reusability
Software reusability reveals the difficulty of modifying code for other uses, including understanding corrections, changes, and improvements. It is related to the difficulty and time for reasonable secondary development and fixing vulnerabilities. Poulin (1994) emphasized reusable software generally has attributes (such as ease of understanding, good error and exception handling, and portability). Fershtman and Gandal (2004) used programming language and operating system as a measuring indicator for OSS. Sen (2006) also proposed that project system compatibility is an important factor. Capiluppi and Boldyreff (2007) emphasized the stability of folders is the key to reusability, so it is necessary to examine the frequency of updates. Update too frequently or only occasionally does not meet requirements. Tamura and Yamada (2007) used a neural network to assess the best release time for OSS, and the result shows it will take at least 149 days for developers. Hauge et al. (2009) used website, documents, license, and release frequency to assess the reusability of OSS. What is more, language translation (Midha and Palvia 2012; Ghapanchi and Tavana 2015) is also an important measurement for reusability. It is defined for measuring how many languages the documents of OSS (such as readme file and license file) has been translated into. As we know, documents play an important role for developers or users to understand OSS.
License
License is defined as “the one complied with open source definition, and it allows the software to be freely used, modified, and shared” (Open Source Initiative 2018).
License type
There are about 80 licenses for open-source software. In terms of copyright, these licenses can be categorized into two classes (i.e., permissive licenses and copyleft licenses) based on whether it is under the request of copyright. From the restriction perspective, these licenses can be categorized into three types (i.e., highly restrictive, restrictive, and unrestrictive) based on the restrictiveness of redistribution rights (Lerner and Tirole 2005). In particular, the highly restrictive license usually requires mandatory open source, like GPL (The GNU General Public License v3.0 2018). The restrictive license does not need to open source when referenced as a library. It has certain commercial value but still have many constraints. The unrestrictive license does not need to open source. However, there still exist other license types. For example, Apache requires patents. BSD (The 2-Clause BSD License 2018; The 3-Clause BSD License 2018) does not require patents, but its binding is regarded as the weakest. Currently, widely used open-source licenses can be classified into Table 3.
Issues of license use
German et al. (2010) analyzed possible license compatibility issues during the software distribution process and discovered some current license issues. Valimaki (2003) analyzed how several open-source companies use dual licensing (i.e., a proprietary license and an open-source license). The case studies in the study is limited. Since, there are almost none companies that actually have an end-user application performed well with a dual licensing model.
Indicators affected by license
Highly restrictive licenses have a significant impact on the indicators of OSS. Lerner and Tirole (2005) analyzed the restricted capacity of each license and the impact of license on some objective attributes of OSS. The author performed empirical studies by conducting a statistical analysis of the data obtained by open-source websites. But the problem of the empirical studies is the obtained data can only reflect the open-source effect by using the current license. There are no empirical studies conducted to prove using other licenses will improve or reduce the open-source effect. Stewart et al. (2005) studied the impact of licenses and sponsorship on OSS. Colazo and Fang (2009) studied the correlation between license and project activities. They put forward a point of observing the permanence of developers firstly. By observing the time interval of the one submits code, we can analyze whether the developer abandons the project. This indicator was innovative at the time. Senyard and Michlmayr (2004) proposed an appropriate license, which will attract developers.
Subramaniam et al. (2009) obtained the percentage of OSS with three types of licenses through classifying open-source data. Then they analyzed the impact of each type of license on user interest, developer interest, and project activity. Based on their experimental results, there are 63% of OSS using GPL, which is a highly restrictive license. They deemed that highly restrictive licenses will discourage developers from choosing that OSS, which will reduce OSS’s popularity since developers may want to retain the right to modify or reuse their own codes. What is more, project administrators are likely to decide which license to use. Therefore, if the project is designed mainly for developers, an unrestrictive license (such as BSD or MIT) is used mostly in academic environment (Lindman et al. 2010). Otherwise, the highly restrictive or restrictive license is valid.
Indicators affecting license
Sen et al. (2008) studied the influence of developers’ motivations and attitudes towards OSS on their choice of licenses. They used an online survey to collect data. However, the data set is too small. Moreover, the focus of their study is to analyze which license a particular group tends to choose. Therefore, there is less analysis of the license itself.
The information of “Indicators affected by license” and “Indicators affecting license” sections is summarized in Table 4. In prior studies, the researchers focused on the study of the influence of licenses on various indicators of OSS and investigated which indicators will affect the choice of license. We can find developers’ motivation and attitude to OSS development, the natural language of developers, and the target user, will all affect it. Among them, if the developer seeks higher redistribution rights and greater status opportunities, the developer may be inclined to choose a less restrictive license. If the developer is looking for a higher social obligation or solving a greater challenge, the developer may choose a more restrictive license. This is in line with our objective perception. At the same time, different restrictive licenses may have a positive or negative impact on the attributes of OSS. But in previous studies, we can notice their conclusions may be controversial. Stewart et al. (2005) proposed that a less restrictive license has a positive impact on the popularity of OSS. At the same time, popularity has a positive impact on vitality, which is also called activity. It can be concluded that less restrictive licenses also have a positive impact on the activities. However, Colazo and Fang (2009) proposed copyrighted licenses have a positive impact on the activities. Their main consideration is whether a license has copyright requirements during the dissemination process. This is also a restrictive aspect of the license. From our objective perception, the more restrictive licenses, the more developers may participate in development activities. But when the restrictions are lower, the popularity of OSS is higher, and the number of users is also higher. Therefore, more bugs or errors may be found, which will also promote the development of OSS. In summary, the impact of open-source licenses on OSS activities still needs more in-depth research.
Popularity
Popularity is the quality, state, or condition of being liked, admired, or supported by many developers. Popularity is often used to measure OSS (Crowston et al. 2006; Midha and Palvia 2012; Subramaniam et al. 2009). Sen (2006) used project popularity as an evaluation basis and analyzed the impact of license type, project age, project status, potential users, and project system compatibility on popularity. Emanuel et al. (2010) used association rules by data mining to analyze the success factors. They used the download number as a measurement for OSS success. They conducted a Unix-like system, translation language (English or European), and stable project status, which positively affected popularity. Senyard and Michlmayr (2004) convinced that users and developers promoted the popularity. However, all of the analyzed attributes are static. And popularity is a dynamic attribute. Using static attributes to evaluate a dynamic attribute is less rigorous. In open-source projects, it usually includes market penetration and user interest.
Market penetration
Market penetration is defined for measuring the using proportion or percentage of a certain OSS under a similar function at a point time. Feller and Fitzgerald (2001) believed some well-known OSS (such as Linux and Apache) could use the rate of market penetration as an evaluation criterion. However, as we all known, it can only be used to evaluate the highly used OSS. The rate of market penetration about the unpopular OSS has large deviations.
User interest
User interest is usually quantified as the number of downloads. Grewal et al. (2006) and Crowston et al. (2004) both used this indicator in their studies. However, the number of downloads is a static indicator. The impact of time on indicators and OSS is not considered from a longitudinal perspective. The advantage of the study (Garousi 2009) is that they considered the lifetime of projects. Crowston et al. (2003) found that users’ satisfaction and participation in discussion or bug reports are essential attributes.
In Table 5, we can find previous studies mainly used downloads number, hit number, and the number of subscribers to quantify the abstract attribute of software popularity. The unique one is the study of Crowston et al. (2003). They used users’ satisfaction and participation to measure popularity. But this indicator is still an abstract indicator. In the study of Guinan et al. (1998), they conducted a questionnaire survey on whether users are satisfied with a software. And Crowston et al. (2003) also used survey for user data collection. Therefore, it is feasible to measure the degree of software satisfaction through a large amount of specific user data. And this is a more concrete approach. As for what factors can affect the popularity of OSS, Stewart et al. (2005) and Wu et al. (2007) focused on the license, project age, status, potential users, system complexity, project centrality, project density, sponsorship, etc.
Developer
A developer in software is a person who writes computer programs. The developer includes many aspects, such as developer capability, developer motivation and project activity.
Developer capability
Developer capability generally reflect the number of developers and the individual contributions of developers. Lerner and Tirole (2005), Garousi (2009), Crowston et al. (2004) and Wu et al. (2007) used the number of developers to scale the performance of OSS. Colazo et al. (2005) emphasized that the diversity of roles and contributions of project participants has a positive effect on OSS success. Tsay et al. (2012) and Fershtman and Gandal (2004) also used the output of each contributor as an measure for evaluating OSS. Chang (2018) has talked about the indicators of developer comparatively overall. He investigated how the number of developers, individual contribution, or developer self ability influences the performance of OSS and how the team structure, leadership, and communication efficiency influence the project progress and developer permanency. Senyard and Michlmayr (2004) summarized the influence of the leadership and management style of OSS authors and the communication style between developers on the whole project. Ke and Zhang (2011) proposed developers’ capability, and their effort will promote the performance of OSS. Greene and Fischer (2016) also concluded that developer capability had a positive effect on OSS performance. Although they came to the same conclusion, they used different datasets. The one is gathered from SourceForge, and the other is gathered from Github.
Developer motivation
Developer motivation is referred to as what motivates developers to decide and continue to contribute to OSS. Markus et al. (2000) proposed to social values (such as altruism, reputation, and ideology) may motivate the contributors. Tsay et al. (2012) measured OSS based on the social and technical characteristics of contributors and their attention and contribution to OSS. They argued task focus and work concentration would promote developer attention. However, the description of the experiment in their study is too brief, even not describe specific features for the chosen data set. Moreover, they did not analyze the correlation between different indicators. Hata et al. (2015) promoted social values and project documents had a positive effect on developers. Also, Fronchetti et al. (2019) analyzed the OSS data of 72 weeks and concluded documents, project age, number of program languages, and its popularity all promoted new developers to join to the OSS.
Project activity
Project activity contains many fields. Raymond (1999) measured it by checking whether there were continuous volunteer developers to fix bugs, add new features, and release new versions frequently or early. Crowston et al. (2003) proposed a two-level hierarchy to evaluate OSS based on empirical research and previous successful Information Systems (IS) models. They found the number of developers involved in the process is an essential attribute to be the evaluation criterion of OSS. This study contains only the opinions of some people participating in the survey, and the survey sample is small. Therefore, results are highly dependent on the quality of the sample population. In addition, there is no proof or in-depth study of survey results. After that, Crowston et al. (2004) proposed the number of developers in the extended development community, project activity, and bug fixing time should also be used to evaluate the performance of OSS. Lerner (2005) evaluated the performance of OSS based on the ranking of activity percentile on SourceForge. Subramaniam (2009) regarded the level of developer interest and project activity as an evaluation measurement of OSS. The author separately analyzed the impact of time-related and time-irrespective indicators. The experiment is relatively complete and puts forward the influence of the operating system on OSS. Based on the basis of the previous experiment, time-related indicators have been added. This is the first quantitative longitudinal study and the evaluation of project attributes is more credible. However, a time-irrespective indicator may also include the platform on which OSS is released. Garousi (2009) analyzed the impact of the ability to handle issues on OSS performance. It is divided into waiting time, the percentage of solved issues, and the age of different types of issues. The age of different types of issues is a relatively new concept and has not been mentioned before in previous studies. The problem of this study is that only four OSS are analyzed. The dataset is insufficient. Midha et al. (2012) used the activities of developers to measure OSS success. They established an evaluation model that includes both external and internal attributes. But their analysis of developer activities only considers the complexity and modularity of source code, which is far from enough. Developer activity should be a time-related indicator and cannot be measured solely by time-irrespective indicators. Norikane et al. (2018) proposed that project activity will promote the developer by using the prediction model. There are more reviews for OSS, and the developer has more possibility to become a long-term developer.
In Table 6, the indicators used to quantify developer attributes include project activities, developers number and their contributions, developer satisfaction, followers number, and the number of projects one developer owned. In other words, the chosen indicators quantify developer attributes from four different aspects: the number of developers, the degree of developers’ attention, the degree of developers’ satisfaction with the project, and the degree of user attention to the project. Unfortunately, most of the researchers only choose one or two aspects to measure the performance of developers in their own study. To our best knowledge, there is no comprehensive measurement of the performance of developers from the above four aspects. Regarding which indicators may affect developers, previous studies analyzed four categories of attributes, developer’ s motivation, user’ s influence on the project, support or restrictions on the project and the mutual influence between each project. The four attributes all belong to the influence of the external environment on the developer. External property of projects is defined as a set of indicators that may affect the development and maintenance of OSS from outside of source code. Previous studies have analyzed the impact of it on developers. Of course, the impact of intrinsic property on developers should also be carefully analyzed. For example, a more general development language may attract more developers. At the same time, there may be differences in code quality among developers. This may cause many developers to promote project activities in the process of continuous communication.
Sponsorship
Sponsorship (Mcdonald 1991) is a contract in which one party provides financial support, and the other party gives back to the payer exploitable commercial potential. In open-source software, sponsors are usually famous enterprises or universities. They aim to enhance their publicity and innovation capacity by attracting external knowledge. Apparently, sponsorship is usually seemed to be the boost of the performance of OSS.
There are many indicators affected by sponsorship. Wu et al. (2007) proposed financial support, which usually be deemed as sponsorship, had positive effect on the performance of OSS. Homscheid et al. (2016) evaluated the influence of firm-sponsorship based on the model of social capital theory and individual’ s value creation. They proposed that sponsorship has a positive effect on the correlation between social capital and source code contribution. However, there was no description about their experiment except data-set to prove their hypothesis. And their conclusion also had no emphasis of their hypothesis. West et al. (2005) believed sponsorship could prevent developers from abandoning the project while it is still usable. And on-going sponsorship provided special support to improve the chances of project success, such as resources, legitimacy, and technical capabilities. But it is likely sponsorship will recruit external contributors and reduce its diversity. Spaeth et al. (2015) proposed perceived community-based credibility and openness of the sponsoring firm have a positive impact on the intrinsic motivation of volunteer participants. But the data set is collected from a single source. To improve the credibility of the conclusions, multi-source data is essential. Teigland et al. (2014) proposed that sponsor had great influence on the ecology of OSS. Open-source communities with corporate sponsorship may be subject to management restrictions from sponsors. And sponsor may interfere with the functional features of the entire project. Therefore, the innovation capabilities of community may be deeply cut down.
In Table 7, we can find that sponsorship as an external attribute has a positive impact on the success of OSS. Specifically, sponsorship promotes the developer‘s permanency, the resource, legitimacy, and technical capability obtained by the project. This is consistent with objective reality. However, we can also find sponsorship has a certain negative impact on innovation capability and developer diversity.
Correlation analysis
According to whether the correlation between the indicators has been confirmed, the correlations can be divided into three types: confirmed correlations, controversial correlations, and new-finding correlations. Based on the above study analysis, we model the correlation between indicators into a directive graph using Gephi Footnote 8, a useful open-source data visualization tool. Figure 2 shows the correlations between various indicators for evaluating OSS mentioned in previous papers, and the width of edges shows the strength of correlations.
Confirmed correlations
In the investigated related studies, 25 studies analyze the correlation between different indicators. However, the focus of their analysis is quite different. Among them, the correlations that has been confirmed by at least two works are listed:
-
license \(\xrightarrow []{negative}\) popularity
The strictness of licenses has a negative effect on popularity. There are four studies (Wu et al. 2007; Stewart et al. 2005; Stewart et al. 2006; Subramaniam et al. 2009), which perform a correlation analysis on 9,119 projects in total. Highly restricted licenses (e.g., GPL) are often acceptable for general users. But for users who use the OSS for secondary development, they will be requested to open source, even if only a small piece of code is used or the code is used as a library function reference. Therefore, using OSS with a highly restricted license may have to reveal code unwilling to make public. As a result, a highly restrictive license may persuade such a part of developers. Although common users and developers have different needs, they both play an irreplaceable role in the process of promoting and developing OSS. What’s more, developers and common users belong to a mutually reinforcing relationship. If a project loses several developers, then the project activity will be significantly reduced or even disappear. This also has a significant attack on the enthusiasm of common users. As a result, the popularity of the whole project will be substantially affected. Therefore, a highly restricted license will limit the popularity of the whole project. An inappropriate choice of license is of great importance.
-
language translation \(\xrightarrow []{positive}\) popularity
Language translation may have a positive effect on popularity, which is often quantified as the number of downloads. Midha and Palvia (2012) and Ghapanchi et al. (2015) perform a correlation analysis on 1,308 projects in total. Language translation is a sub-type indicator. It presents how many sorts of language documents have been translated into to promote its spread. Apparently, the larger number of documents it is, the more people will understand it, and the larger possibility of widely spread may be.
-
copyleft \(\xrightarrow []{positive}\) project activity
In his two studies (Colazo and Fang 2009; Colazo et al. 2005), Colazo found copyleft has a positive influence on the number of developers and project activity based on 62 projects in total. Copyleft can protect the rights of developers since it prevents others from directly copying developers’ source code. Compared with the ones without copyleft, it is obvious OSS with a copyleft can attract more developers to invest their energy.
-
project activity \(\xrightarrow []{positive}\) user interest
Project activity has a positive effect on user interest. Subramaniam et al. (2009) and Stewart and Ammeter (2002) summarized that conclusion. They performed a correlation analysis of 8,629 projects in total. On the one hand, project activity represents OSS is still maintained by developers, so it is easier for users to ask for help if they encounter problems. On the other hand, it means OSS may still have room for development, and problems can be discovered. Developers may encounter an error or bug during programming, using or debugging, and they may even get a CVE ID, which is attractive for any users.
-
developer interest \(\xrightarrow []{positive}\) user interest
Developer interest has a positive effect on user interest. Ghapanchi (2015) and Subramaniam et al. (2009) performed a correlation analysis on 10,036 projects in total. Developer interest is a signal of how much effort a developer puts into an OSS. Therefore, the more developers devote to projects, the better quality and security projects will become. What is more, users usually choose the project with high quality and security. Therefore developer interest may promote the development process of OSS, thus affecting the external characteristics of the whole OSS and arousing users’ interest.
-
sponsor \(\xrightarrow []{positive}\) popularity
The sponsor has a positive effect on popularity (i.e., user interest). And it is proved non-market sponsor has a more positive effect on popularity. Stewart et al. (2002, 2005, 2006) demonstrated this conclusion in their three studies with 518 projects in total. In our opinion, sponsorship improves the ability of OSS to deal with risks and the possibility of maintaining long-term support from developers. Both of these capabilities are very attractive to users. In the use of software, it is common to face risks. If there is no timely and effective technical support, it will cause incalculable losses to users.
-
sponsor \(\xrightarrow []{positive}\) project activity
The sponsor also has a positive effect on the project activity of OSS. Wu et al. (2007) and Stewart et al. (2006) drew the same conclusion by analyzing 274 projects. Sponsor is not only a recognition of their work, but also a responsibility to develop better OSS. As a result, developers will be more active and sustained with the sponsorship.
-
project status\( \xrightarrow []{positive}\) popularity
Project status has a positive effect on popularity (i.e., user interest). OSS may be more popular when it is in a stable status. Stewart and Ammeter (2002), Sen (2006) and Subramaniam et al. (2009) performed a correlation analysis on 22,552 projects in total. The stable status reflects that the OSS has been modified and tested by multiple parties and has remained stable in function. This will make it easier for the majority of users to have confidence in the software’s performance and security. Therefore, users may prefer stable projects while choosing function-similar OSS.
-
project age \(\xrightarrow []{positive}\) popularity
Project age has a positive effect on popularity. Wu et al. (2007), Ghapanchi and Tavana (2015) and Sen (2006) have proved this point through experiments with 14,004 projects in total. The older the OSS project is, the lager number of testings or patches the project may has. The problems that may be faced about project function and safety can also be referred to the experience shared by predecessors. Obviously, this is more popular with users than new OSS.
-
unix-like operating system \(\xrightarrow []{positive}\) popularity
Sen (2006) proposed a Unix-like operating system had a positive effect on popularity. And Ghapanchi and Tavana (2015) argued the more types of operating systems OSS could be used on, the more popular OSS would be. They verified the above conjecture through experiments with 13,948 projects. Windows OS is the most used operating system in the world, and general software can be deployed and used on windows. Therefore, OSS can be used on Unix-like operating systems, which means OSS may satisfy the requirements of a large part of users. There will be fewer failures due to system reasons.
-
unix-like operating system \(\xrightarrow []{positive}\) developer interest
The Unix-like operating system has a positive correlation with developer interest. Subramaniam et al. (2009) and Beecher et al. (2008) achieved this finding through experiments with 8,669 projects in total. As we know, although Windows is user-friendly, it is not very friendly to developers. Developers actually use Unix-like operating systems more. Therefore, OSS that can be used in a Unix-like operating system will be more attractive to developers.
-
communication effectiveness \(\xrightarrow []{positive}\) project activity
Communication effectiveness apparently has a positive influence on project activity. Chang (2018) conducted this point by analyzing 143 projects using inferential statistics method. Stewart et al. (2006) analyzed the effect of communication effectiveness on the entire open-source team. And they came to the same conclusion as Chang. What’s more, Senyard and Michlmayr (2004) also agreed with this.
The above confirmed correlations are listed in Table 8.
Controversial correlations
But in these prior studies, there are still some views that have not reached a unified point. For example, Stewart et al. (2006) proposed user interest has a positive effect on project activity. And the authors had proved his opinion by experiment and calculated the correlation value (14.854). However, Subramaniam et al. (2009) concluded that user interest has a negative effect on project activity. They also calculated the correlation value (-0.081), and its signature is 0.0003.
The status of open-source projects has a certain impact on their popularity, which is the choice of all the users. But for the impact of developers, there are theories (Stewart and Ammeter 2002) that indicate there may be a situation where the project is stable, but the developer’s interest may decrease. To our best knowledge, there are no experiments to verify this conjecture. Moreover, it can be found from Fig. 2 that project status promotes popularity, and popularity also promotes project activity to a certain extent. Therefore, we boldly guess that developer interest or project activity in a stable state will remain as the one in alpha or beta version.
In addition, Beecher et al. (2008) proposed Debian had a positive effect on the inter-release time of OSS. It means if OSS is designed for using on Debian systems, it will need more time for waiting a new time. As we all known, Debian system is a type of Unix-like system. Therefore, the conclusion can also be regarded as Unix-like system may postpone the inter-release time of OSS. However, Subramaniam et al. (2009) concluded Unix system has a positive effect on project activity, which is often used to measure the frequency of releasing new versions, and the value of correlation are 0.389 (0.150) and 0.134 (0.029) in two experiments of two periods. They came to the opposite conclusions, and there is no new work about this part. We can not justify for sure which one is true.Beecher et al. (2008) did not conduct experiments to verify his theory. Subramaniam et al. (2009) is more convincible.
What is more, the effect of the license also has something confused. Lerner and Tirole (2005) concluded that license is independent of the project status of OSS. But, Comino et al. (2007) proved that license plays a negative effect on project status, and the value of correlation is -0.1156. More work is needed to measure the possible ambiguity between indicators accurately.
Last but not least, Wu et al. (2007) and Joy et al. (2018) proposed programming language had none promotion effect on the popularity of OSS. But in the next work, Ghapanchi and Tavana (2015) found programming language had a positive influence on the popularity. Apparently, the second work is more convincing. Although there are not many differences between languages, some people may be only proficient in one programming language. Therefore, the OSS written with the universal programming language may attract the most followers or users. These controversial correlations are summarized in Table 9.
Newly-found correlations
Figure 3 is an example from Fig. 2, including the part related to the indicator, developer number. From Fig. 3, we can see there are obvious transitive law. For example, copyleft has a positive effect on the developer number, and the developer number has a positive effect on project activity. Due to predecessors’ conclusion, copyleft does have a positive effect on project activity. There are also many other similar examples in Figs. 2 and 3. Therefore, we can use this transitive law to find new correlations that have not yet been discovered, and our findings are listed as follows.
-
Popularity, project activity, user interest, and developer interest are more representative and more commonly used to measure the status of OSS. The nodes named popularity, project activity, user interest, and developer interest are of larger in-degree. As we can see, previous studies mainly investigated how other indicators influence them or OSS’s performance. Therefore, these four attributes are classified into two attributes, popularity and developer, as a basis for evaluating OSS. As for code, license and sponsorship, as the inherent attributes of OSS, they are also very important for evaluation. Therefore, our evaluation indicators are divided into the above five categories.
-
Copyleft, sponsor, and Unix-like operating system may have a positive effect on project status. That means an OSS project has a larger possibility of attaining a stable version since copyleft promotes both the project activity (Colazo and Fang 2009; Subramaniam et al. 2009) and developer number (Colazo et al. 2005) (Colazo and Fang 2009). What’s more, both of them promote the project status (Chang 2018) (Stewart et al. 2006; Ghapanchi 2015). Therefore, we deem copyleft will promote OSS to attain a stable status. Also, the Unix-like operating system and sponsor both have a positive effect on project activity (Subramaniam et al. 2009; Beecher et al. 2008; Wu et al. 2007; Stewart et al. 2006). Therefore, they also may promote project status.
-
Social identification may have a positive on project status and project activity. Social identification appeals to a larger number of developers (Spaeth et al. 2014), and a larger number of developers contribute to both project status (Chang 2018; Stewart et al. 2006) and project activities (Chang 2018; Comino et al. 2007).
-
Many indicators can promote developer interest, such as developer sustainability (Ghapanchi 2015), release frequency (Ghapanchi 2015), project status (Subramaniam et al. 2009; Comino et al. 2007), Unix-like operating system (Beecher et al. 2008; Subramaniam et al. 2009), C-group language (Subramaniam et al. 2009), and responsibility assignment (Midha and Palvia 2012). And developer interest has a positive influence on project activity (Subramaniam et al. 2009) and user interest (Ghapanchi 2015) (Subramaniam et al. 2009). Therefore, all of the above indicators may promote project activity and user interest.
-
Copyleft may have a positive effect on popularity. As an important safeguard, copyleft can make developers more optimistic about the prospects of the project and attract more developers (Colazo and Fang 2009) (Subramaniam et al. 2009; Colazo et al. 2005). And the more developers, the more popular the project will be Senyard and Michlmayr (2004); Beecher et al. (2008).
-
Leadership and female developers may have a positive effect on popularity and project activity. They promote communication effectiveness (Chang 2018), and communication effectiveness promotes popularity (Senyard and Michlmayr 2004; Crowston and Shamshurin 2017) and project activity (Stewart and Gosain 2006; Beecher et al. 2008).
-
The license may have a positive effect on project activity since the license has a positive effect on the node of the target at administrator or developer (Lerner and Tirole 2005), and that node has a strong positive effect on project activity (Subramaniam et al. 2009; Comino et al. 2007).
-
As we can see, the more popular an OSS is, the more active it will be Stewart et al. (2005). From Fig. 2, there are many indicators that can promote popularity, such as application (Stewart and Ammeter 2002), translation languages (Emanuel et al. 2010), vitality (Stewart and Ammeter 2002), project age (Wu et al. 2007; Sen 2006), developer capacity (Ke and Zhang 2011), and modularity (Senyard and Michlmayr 2004; Midha and Palvia 2012). As a result, they may also promote project activity.

Discussion
Threats to validity
Since the research interest in OSS has continued to decline in recent years, there are not many studies that analyze the performance or success of OSS, although these are of great practical value. Therefore, the mentioned papers were basically published five years or even ten years ago, and only a small part of them was published in recent years. With the development of time, the conclusions drawn in these papers may be different from the current situation. This is a problem that is not solved in the article. Secondly, the paper only analyzes the relevant data obtained by predecessors, without conducting separate experimental verification. As the current status of OSS may have some slight changes with the above, specific experimental data may be required for actual evaluation to verify the conclusion. Finally, since we have not conducted any cross-checks for indicator identification and correction analysis, there may be some mistakes in the identification and analysis process.
Potential applications
Our model is of great significance to developers, users and software analysts. For developers, in the development phase, they can use the indicators to evaluate basic attributes of OSS and its R&D team. Find the shortcomings of software or team in terms of quality or security, and make corresponding modifications. Before releasing stable version of OSS, they can evaluate again, and then publish the results in the readme file to facilitate user selection and use. For users, this model can be used to evaluate which OSS is the least likely to face quality or security issues under the condition of the same function. For software analysts, our model can provide a certain degree of theoretical guidance for evaluating the ease of use or security of OSS in the future.
Conclusion
In this paper, we conduct an empirical study on evaluation indicators and the correlation between these indicators. We divide the evaluation indicators into five aspects: code, developer, license, sponsorship, and user. What’s more, we figure out 13 confirmed correlations and four cases with divergence in the studies on correlations between indicators. Finally, we discuss how our conclusions can be used for guiding the choice of OSS.
Availability of data and materials
We confirm that this manuscript has not been published elsewhere and is not under consideration by another journal.
References
Abductive Inference (1994) Computation, Philosophy, Technology. Cambridge University Press. https://doi.org/10.1017/CBO9780511530128.
Aberdour, M (2007) Achieving quality in open-source software. IEEE Softw 24(1):58–64.
Aggarwal, A, Jalote P (2006) Integrating static and dynamic analysis for detecting vulnerabilities In: 30th Annual International Computer Software and Applications Conference (COMPSAC’06), 343–350, Chicaco. https://doi.org/10.1109/COMPSAC.2006.55.
Aitken, AC (1936) Iv.—on least squares and linear combination of observations. Proc R Soc Edinb 55:42–48. https://doi.org/10.1017/S0370164600014346.
Amrollahi, A, Khansari M, Manian A (2014) Int J Inf Commun Technol Res 6:67–77. https://doi.org/10.13140/2.1.4835.1367.
Andersen, EB (1982) Latent structure analysis: A survey. Scand J Stat 9(1):1–12.
Bao, L, Xia X, Lo D, Murphy GC (2019) A large scale study of long-time contributor prediction for github projects. Trans Softw Eng IEEE:1–1. https://doi.org/10.1109/TSE.2019.2918536.
Beecher, K, Boldyreff C, Capiluppi A, Rank S (2008) Evolutionary success of open source software: an investigation into exogenous drivers. Electron Commun EASST 8. https://doi.org/10.14279/tuj.eceasst.8.113.111.
Boehmke, BC, Hazen BT (2017) The future of supply chain information systems: The open source ecosystem. Glob J Flex Syst Manag 18(2):163–168.
Bretthauer, D (2001) Open Source Software: A History. Published Works 7. https://opencommons.uconn.edu/libr_pubs/7. Accessed 12 Oct 2020.
Brooks, N (2003) Vulnerability, risk and adaptation: A conceptual framework. Tyndall Cent Clim Chang Res Work Pap 38:1–16.
Capiluppi, A, Boldyreff C (2007) Coupling patterns in the effective reuse of open source software In: First International Workshop on Emerging Trends in FLOSS Research and Development (FLOSS’07: ICSE Workshops 2007), 9–9, Minneapolis. https://doi.org/10.1109/FLOSS.2007.4.
Chang, L (2018) Motivations, Team Dynamics, Development Practices and How They Impact the Success of Open Source Software: A Study of Projects of Code for America Brigades. Electron Theses Dissertations:1528. https://digitalcommons.du.edu/etd/1528.
Chen, X, Probert D, Zhou Y, Su J (2015) Successful or unsuccessful open source software projects: What is the key? In: 2015 Science and Information Conference (SAI), 277–282. https://doi.org/10.1109/SAI.2015.7237155.
Chen, H-T, Rossi PH (1983) Evaluating with sense: The theory-driven approach. Eval Rev 7(3):283–302. https://doi.org/10.1177/0193841X8300700301.
Cheng, J, Guo JLC (2019) Activity-based analysis of open source software contributors: Roles and dynamics In: 2019 IEEE/ACM 12th International Workshop on Cooperative and Human Aspects of Software Engineering (CHASE), 11–18. https://doi.org/10.1109/CHASE.2019.00011.
Cristescu, M-P, Cristescu C-I (2009) Open source software reliability, features and tendence. Open Source Sci J 1(1):163–178.
Colazo, J, Fang Y (2009) Impact of license choice on open source software development activity. J Am Soc Inf Sci Technol 60(5):997–1011.
Colazo, JA, Fang Y, Neufeld D (2005) Development Success in Open Source Software Projects: Exploring the Impact of Copylefted Licenses. AMCIS 2005 Proceedings: 432. https://aisel.aisnet.org/amcis2005/432.
Comino, S, Manenti F, Parisi ML (2007) From planning to mature: On the success of open source projects. Res Policy 36(10):1575–1586.
Coverity Scan-Open Source Report (2017). https://www.synopsys.com/blogs/software-security/2017-coverity-scan-report-open-source-security/. Accessed 12 Oct 2020.
Crowston, K, Annabi H, Howison J, Masango C (2004) Towards a portfolio of floss project success measures In: Workshop on Open Source Software Engineering, 26th International Conference on Software Engineering.. IET, Edinburgh.
Crowston, K, Annabi H, Howison J (2003) Defining Open Source Software project success In: ICIS 2003 Proceedings of the International Conference on Information Systems (ICIS 2003), Seattle. https://doi.org/10.1287/mnsc.1060.0550.
Crowston, K, Howison J, Annabi H (2006) Information systems success in free and open source software development: Theory and measures. Softw Process Improv Pract 11(2):123–148.
Crowston, K, Shamshurin I (2017) Core-periphery communication and the success of free/libre open source software projects. J Internet Serv Appl 8:1–11.
del Bianco, V, Lavazza L, Morasca S, Taibi D (2009) Quality of Open Source Software: The QualiPSo Trustworthiness Model. In: Boldyreff C, Crowston K, Lundell B, Wasserman A (eds)Open Source Ecosystems: Diverse Communities Interacting, 199–212.. Springer Berlin Heidelberg, Berlin, Heidelberg.
Dunnett, CW (1955) A multiple comparison procedure for comparing several treatments with a control. J Am Stat Assoc 50(272):1096–1121. https://doi.org/10.1080/01621459.1955.10501294.
Ellison, RJ, Woody C (2010) Supply-Chain Risk Management: Incorporating Security into Software Development In: 2010 43rd Hawaii International Conference on System Sciences, 1–10, Honolulu. https://doi.org/10.1109/HICSS.2010.355.
Emanuel, AWR, Wardoyo R, Istiyanto JE, Mustofa K (2010) Success factors of oss projects from sourceforge using datamining association rule In: 2010 International Conference on Distributed Frameworks for Multimedia Applications, 1–8, Jogjakarta.
English, R, Schweik CM (2007) Identifying success and tragedy of floss commons: A preliminary classification of sourceforge.net projects In: First International Workshop on Emerging Trends in FLOSS Research and Development (FLOSS’07: ICSE Workshops 2007), 11–11. https://doi.org/10.1109/FLOSS.2007.9.
Erturk, E. (2012) A case study in open source software security and privacy: Android adware In: World Congress on Internet Security (WorldCIS-2012), 189–191, Guelph.
Ezell, BC (2010) Infrastructure vulnerability assessment model (i-vam). Risk Analysis 27(3):571–583.
Feller, J, Fitzgerald B (2001) Understanding open source software development. Itnow 7(1):31.
Fershtman, C, Gandal N (2004) The Determinants of Output Per Contributor in Open Source Projects: An Empirical Examination. C.E.P.R. Discussion Papers, London. https://EconPapers.repec.org/RePEc:cpr:ceprdp:4329.
Foolbox Native (2020) Welcome to Foolbox — Foolbox 2.3.0 documentation. https://foolbox.readthedocs.io/en/latest/. Accessed 12 Oct 2020.
Feitelson, DG, Heller GZ, Schach SR (2006) An empirically-based criterion for determining the success of an open-source project In: Australian Software Engineering Conference (ASWEC’06), 6–368. https://doi.org/10.1109/ASWEC.2006.12.
Frei, S, May M, Fiedler U, Plattner B (2006) Large-Scale Vulnerability Analysis In: Proceedings of the 2006 SIGCOMM Workshop on Large-Scale Attack Defense, 131–138.. Association for Computing Machinery, New York. https://doi.org/10.1145/1162666.1162671.
Fronchetti, F, Wiese I, Pinto G, Steinmacher I (2019) What attracts newcomers to onboard on oss projects? tl;dr: Popularity. In: Bordeleau F, Sillitti A, Meirelles P, Lenarduzzi V (eds)Open Source Systems, 91–103.. Springer, Cham.
Garousi, V (2009) Investigating the success factors of opensource software projects across their lifetime. J Softw Eng Stud 4(1):1–15.
German, DM, Di Penta M, Davies J (2010) Understanding and Auditing the Licensing of Open Source Software Distributions In: 2010 IEEE 18th International Conference on Program Comprehension, 84–93, Braga. https://doi.org/10.1109/ICPC.2010.48.
Gezici, B, Özdemir N, Yılmaz N, Coşkun E, Tarhan A, Chouseinoglou O (2019) Quality and Success in Open Source Software: A Systematic Mapping In: 2019 45th Euromicro Conference on Software Engineering and Advanced Applications (SEAA), 363–370, Kallithea. https://doi.org/10.1109/SEAA.2019.00062.
Ghapanchi, AH (2015) Investigating the interrelationships among success measures of open source software projects. J Organ Comput Electron Commer 25(1):28–46.
Ghapanchi, AH, Tavana M (2015) A longitudinal study of the impact of open source software project characteristics on positive outcomes. Inf Syst Manag 32(4):285–298.
Giuri, P, Ploner M, Rullani F, et al. (2004) Skills and openness of OSS projects: Implications for performance[J]. Paper provided by Laboratory of Economics and Management (LEM), Sant’ Anna School of Advanced Studies, Pisa, Italy in its series LEM Papers Series with number 2004, 19.
Golden, B (2008) Making Open Source Ready for the Enterprise: The Open Source Maturity Model. Open Source Business Resource. http://timreview.ca/article/145.
Gordon, TF (2011) Analyzing Open Source License Compatibility Issues with Carneades In: Proceedings of the 13th International Conference on Artificial Intelligence and Law, 51–55.. Association for Computing Machinery, New York. https://doi.org/10.1145/2018358.2018364.
Greene, GJ, Fischer B (2016) CVExplorer: Identifying candidate developers by mining and exploring their open source contributions In: 2016 31st IEEE/ACM International Conference on Automated Software Engineering (ASE), 804–809, Singapore.
Grewal, R, Lilien GL, Mallapragada G (2006) Location, location, location: How network embeddedness affects project success in open source systems. Manag Sci 52(7):1043–1056.
Guinan, P, Cooprider J, Faraj S (1998) Enabling software development team performance during requirements definition: A behavioral versus technical approach. Inf Syst Res 9:101–125. https://doi.org/10.1287/isre.9.2.101.
Hanoğlu, E, Tarhan A (2019) An empirical study on the relationship between open source software success and test effort In: 2019 4th International Conference on Computer Science and Engineering (UBMK), 688–692. https://doi.org/10.1109/UBMK.2019.8907012.
Hata, H, Todo T, Onoue S, Matsumoto K (2015) Characteristics of sustainable oss projects: A theoretical and empirical study In: 2015 IEEE/ACM 8th International Workshop on Cooperative and Human Aspects of Software Engineering, 15–21. https://doi.org/10.1109/CHASE.2015.9.
Hauge, O, Osterlie T, Sorensen C, Gerea M (2009) An empirical study on selection of open source software - preliminary results In: 2009 ICSE Workshop on Emerging Trends in Free/Libre/Open Source Software Research and Development, 42–47. https://doi.org/10.1109/FLOSS.2009.5071359.
Hoepman, J-H, Jacobs B (2007) Increased security through open source. Commun ACM 50(1):79–83.
Homscheid, D, Schaarschmidt M (2016) Between Organization and Community: Investigating Turnover Intention Factors of Firm-Sponsored Open Source Software Developers In: Proceedings of the 8th ACM Conference on Web Science, 336–337.. Association for Computing Machinery, New York. https://doi.org/10.1145/2908131.2908200.
Houmb, SH, Franqueira VN, Engum EA (2010) Quantifying security risk level from cvss estimates of frequency and impact. J Syst Softw 83(9):1622–1634.
Huang, M, Yang L, Yang Y (2006) A development process for building oss-based applications. In: Li M, Boehm B, Osterweil LJ (eds)Unifying the Software Process Spectrum, 122–135.. Springer, Berlin, Heidelberg.
Israeli, A, Feitelson DG (2007) Success of open source projects: Patterns of downloads and releases with time In: IEEE International Conference on Software-Science, Technology Engineering (SwSTE’07), 87–94. https://doi.org/10.1109/SwSTE.2007.11.
James, LR, Singh BK (1978) An introduction to the logic, assumptions, and basic analytic procedures of two-stage least squares. Psychol Bull 85(5). https://doi.org/10.1037/0033-2909.85.5.1104.
Jensen, FV (1996) Introduction to Bayesian Networks, 1st ed. Springer, Berlin, Heidelberg.
Joy, A, Thangavelu S, Jyotishi A (2018) Performance of github open-source software project: An empirical analysis In: 2018 Second International Conference on Advances in Electronics, Computers and Communications (ICAECC), 1–6. https://doi.org/10.1109/ICAECC.2018.8479462.
Karl Pearson, FRS (1901) Liii. on lines and planes of closest fit to systems of points in space. Lond Edinb Dublin Phil Mag J Sci 2(11):559–572. https://doi.org/10.1080/14786440109462720.
Ke, W, Zhang P (2011) Effects of empowerment on performance in open-source software projects. IEEE Trans Eng Manag 58(2):334–346. https://doi.org/10.1109/TEM.2010.2096510.
Kennedy, DM (2001) A primer on open source licensing legal issues: Copyright, copyleft and copyfuture. Saint Louis Univ Public Law Rev 20(2 Article 7).
Kuwata, Y, Takeda K, Miura H (2014) A study on maturity model of open source software community to estimate the quality of products. Procedia Comput Sci 35:1711–1717.
Legendre, AM (1806) Nouvelles méthodes pour la détermination des orbites des comètes: avec un supplément contenant divers perfectionnemens de ces méthodes et leur application aux deux comètes de 1805. Courcier. https://books.google.com/books?id=FRcOAAAAQAAJ. Accessed 12 Oct 2020.
Lerner, J, Tirole J (2005) The scope of open source licensing. J Law Econ Organ 21(1):20–56.
Levy, E (2003) Poisoning the software supply chain. IEEE Secur Priv 1(3):70–73.
Lin, C, Chen C, Laih C (2008) A Study and Implementation of Vulnerability Assessment and Misconfiguration Detection In: 2008 IEEE Asia-Pacific Services Computing Conference, 1252–1257, Yilan. https://doi.org/10.1109/APSCC.2008.212.
Lindman, J, Paajanen A, Rossi M (2010) Choosing an open source software license in commercial context: A managerial perspective In: 2010 36th EUROMICRO Conference on Software Engineering and Advanced Applications, 237–244. https://doi.org/10.1109/SEAA.2010.26.
Lowry, R (2008) Concepts and Applications of Inferential Statistics. Online Statistic Textbook. http://faculty.vassar.edu/lowry/webtext.html. Accessed 12 Oct 2020.
Marconato, GV, Nicomette V, Kaâniche M (2012) Security-related vulnerability life cycle analysis In: 2012 7th International Conference on Risks and Security of Internet and Systems (CRiSIS), 1–8, Cork. https://doi.org/10.1109/CRISIS.2012.6378954.
Margan, D, Čandrlić S (2015) The success of open source software: A review In: 2015 38th International Convention on Information and Communication Technology, Electronics and Microelectronics (MIPRO), 1463–1468. https://doi.org/10.1109/MIPRO.2015.7160503.
Markus, ML, Agres BMCE (2000) What makes a virtual organization work?MIT Sloan Manag Rev 42(1):13.
Mcdonald, C (1991) Sponsorship and the Image of the Sponsor. Eur J Market 25(11):31–38. https://doi.org/10.1108/EUM0000000000630.
Mell, P, Scarfone K, Romanosky S (2006) Common vulnerability scoring system. IEEE Secur Priv 4(6):85–89.
Mell, P, Scarfone K, Romanosky S (2007) A complete guide to the common vulnerability scoring system version 2.0 In: Published by FIRST-forum of incident response and security teams (Vol. 1), 23.
Midha, V, Palvia P (2012) Factors affecting the success of open source software. J Syst Softw 85(4):895–905.
Norikane, T, Ihara A, Matsumoto K (2018) Do review feedbacks influence to a contributor’s time spent on oss projects? In: 2018 IEEE International Conference on Big Data, Cloud Computing, Data Science Engineering (BCD), 109–113. https://doi.org/10.1109/BCD2018.2018.00028.
Open Source Initiative (2018). https://opensource.org/licenses. Accessed 12 Oct 2020.
Paulk, MC, Curtis B, Chrissis MB, Weber CV (1993) Capability maturity model, version 1.1. IEEE Softw 10(4):18–27.
Peng, G (2019) Co-membership, networks ties, and knowledge flow: An empirical investigation controlling for alternative mechanisms. Decis Support Syst 118:83–90. https://doi.org/10.1016/j.dss.2019.01.005.
Petrinja, E, Nambakam R, Sillitti A (2009) Introducing the OpenSource Maturity Model In: 2009 ICSE Workshop on Emerging Trends in Free/Libre/Open Source Software Research and Development, 37–41, Vancouver. https://doi.org/10.1109/FLOSS.2009.5071358.
Poulin, JS (1994) Measuring software reusability In: Proceedings of 1994 3rd International Conference on Software Reuse, 126–138, Rio de Janeiro. https://doi.org/10.1109/ICSR.1994.365803.
Raymond, E (1999) The cathedral and the bazaar. Knowl Technol Policy 12(3):23–49.
Rebouças, M, Santos RO, Pinto G, Castor F (2017) How does contributors’ involvement influence the build status of an open-source software project? In: 2017 IEEE/ACM 14th International Conference on Mining Software Repositories (MSR), 475–478. https://doi.org/10.1109/MSR.2017.32.
Robinson, WN, Vlas RE (2015) Requirements evolution and project success: An analysis of sourceforge projects. AMCIS.
Samoladas, I, Gousios G, Spinellis D, Stamelos I (2008) The SQO-OSS Quality Model: Measurement Based Open Source Software Evaluation. In: Russo B, Damiani E, Hissam S, Lundell B, Succi G (eds)Open Source Development, Communities and Quality, 237–248.. Springer US, Boston.
Schweik, C (2009) The Dependent Variable: Defining Open Source “Success” and “Abandonment” Using Sourceforge.Net Data. National Center for Digital Government Working Paper Series: 35. https://scholarworks.umass.edu/ncdg/35.
Sen, R, Subramaniam C, Nelson ML (2008) Determinants of the choice of open source software license. J Manag Inf Syst 25(3):207–240.
Schryen, G, Kadura R (2009) Open source vs. closed source software: towards measuring security In: Proceedings of the 2009 ACM Symposium on Applied Computing (SAC), 2016–2023.. ACM, Honolulu. https://doi.org/10.1145/1529282.1529731.
Semeteys, R (2008) Method for Qualification and Selection of Open Source Software. Talent First Network, Ottawa. http://timreview.ca/article/146.
Sen, R (2006) Open source software development projects: determinants of project popularity. Technical report, EERI Research Paper Series.
Senyard, A, Michlmayr M (2004) How to have a successful free software project In: 11th Asia-Pacific Software Engineering Conference, 84–91. https://doi.org/10.1109/APSEC.2004.58.
Silic, M, Back A (2016) The influence of risk factors in decision-making process for open source software adoption. Int J Inf Technol Dec Making 15(01):151–185.
Spaeth, S, Krogh GV, He V (2014) Research Note — Perceived Firm Attributes and Intrinsic Motivation in Sponsored Open Source Software Projects. Inf Syst Res 26(1):1–241.
Spaeth, S, von Krogh G, He F (2015) Research note - perceived firm attributes and intrinsic motivation in sponsored open source software projects. Inf Syst Res 26(1):224–237. https://doi.org/10.1287/isre.2014.0539.
Stewart, K, Ammeter T (2002) An exploratory study of factors influencing the level of vitality and popularity of open source projects. ICIS 2002 Proceedings: 88.
Stewart, KJ, Ammeter AP, Maruping LM (2005) A Preliminary Analysis of the Influences of Licensing and Organizational Sponsorship on Success in Open Source Projects In: Proceedings of the 38th Annual Hawaii International Conference on System Sciences, 197c–197c, Big Island. https://doi.org/10.1109/HICSS.2005.38.
Stewart, KJ, Ammeter AP, Maruping LM (2006) Impacts of license choice and organizational sponsorship on user interest and development activity in open source software projects. Inf Syst Res 17(2):126–144.
Stewart, KJ, Gosain S (2006) The impact of ideology on effectiveness in open source software development teams. Mis Q 30(2):291–314.
Subramaniam, C, Sen R, Nelson ML (2009) Determinants of open source software project success: A longitudinal study. Decis Support Syst 46(2):576–585.
Tamura, Y, Yamada S (2007) Software reliability assessment and optimal version-upgrade problem for open source software In: 2007 IEEE International Conference on Systems, Man and Cybernetics, 1333–1338. https://doi.org/10.1109/ICSMC.2007.4413582.
Teigland, R, Gangi PMD, Flåten B, Giovacchini E, Pastorino N (2014) Balancing on a tightrope: Managing the boundaries of a firm-sponsored OSS community and its impact on innovation and absorptive capacity. Inf Organ 24(1):25–47. https://doi.org/10.1016/j.infoandorg.2014.01.001.
The 2-Clause BSD License (2018). https://opensource.org/licenses/BSD-2-Clause. Accessed 12 Oct 2020.
The 3-Clause BSD License (2018). https://opensource.org/licenses/BSD-3-Clause. Accessed 12 Oct 2020.
The GNU General Public License v3.0 (2018). https://www.gnu.org/licenses/gpl-3.0.html. Accessed 12 Oct 2020.
Tsay, JT, Dabbish L, Herbsleb J (2012) Social Media and Success in Open Source Projects In: Proceedings of the ACM 2012 Conference on Computer Supported Cooperative Work Companion, 223–226.. Association for Computing Machinery, New York. https://doi.org/10.1145/2141512.2141583.
Valimaki, M (2003) Dual licensing in open source software industry. Systèmes d’Information Manag 8(1):63–75.
Wasserman, A, Pal M, Chan C (2006) The business readiness rating model: an evaluation framework for open source In: Proceedings of the EFOSS Workshop, Como.
West, J, O’Mahony S (2005) Contrasting community building in sponsored and community founded open source projects In: 38th Hawaii International Conference on System Sciences. https://doi.org/10.1109/HICSS.2005.166.
Wilcoxon, F (1945) Individual comparisons by ranking methods. Biom Bull 1(6):80–83.
Wolf, S, Hinkel J, Hallier M, Bisaro A, Lincke D, Ionescu C, Klein RJT (2013) Clarifying vulnerability definitions and assessments using formalisation. Int J Clim Change Strateg Manag 5(1):54–70.
Wu, J, Goh K-Y, Tang Q (2007) Investigating Success of Open Source Software Projects: A Social Network Perspective. ICIS 2007 Proceedings: 105. http://aisel.aisnet.org/icis2007/105.
Yang, X, Hu D, Robert DM (2013) How microblogging networks affect project success of open source software development In: 2013 46th Hawaii International Conference on System Sciences, 3178–3186. https://doi.org/10.1109/HICSS.2013.251.
Yang, J, Liu Y, Xie M, Zhao M (2016) Modeling and analysis of reliability of multi-release open source software incorporating both fault detection and correction processes. J Syst Softw 115:102–110.
Yuan, L, Wang H, Yin G, Shi D, Li X, Liu B (2010) Mining frequent development patterns of roles in open source software In: 2010 7th International Conference on Ubiquitous Intelligence Computing and 7th International Conference on Autonomic Trusted Computing, 444–448. https://doi.org/10.1109/UIC-ATC.2010.113.
Zellner, A, Theil H (1962) Three-stage least squares: Simultaneous estimation of simultaneous equations. Econometrica 30(1):54–78.
Zhu, M, Pham H (2018) A multi-release software reliability modeling for open source software incorporating dependent fault detection process. Ann Oper Res 269(1-2):773–790.
Funding
Not applicable.
Author information
Authors and Affiliations
Contributions
All authors have contributed to this manuscript and approve of this submission. YZ and RL participated in all the work and drafting the article. Prof. XC and JZ made a decisive contribution to the content of research and revising the article critically.
Corresponding authors
Ethics declarations
Competing interests
The authors declare that they have no competing interests.
Additional information
Publisher’s Note
Springer Nature remains neutral with regard to jurisdictional claims in published maps and institutional affiliations.
Rights and permissions
Open Access This article is licensed under a Creative Commons Attribution 4.0 International License, which permits use, sharing, adaptation, distribution and reproduction in any medium or format, as long as you give appropriate credit to the original author(s) and the source, provide a link to the Creative Commons licence, and indicate if changes were made. The images or other third party material in this article are included in the article’s Creative Commons licence, unless indicated otherwise in a credit line to the material. If material is not included in the article’s Creative Commons licence and your intended use is not permitted by statutory regulation or exceeds the permitted use, you will need to obtain permission directly from the copyright holder. To view a copy of this licence, visit http://creativecommons.org/licenses/by/4.0/.
About this article

Cite this article
Zhao, Y., Liang, R., Chen, X. et al. Evaluation indicators for open-source software: a review. Cybersecur 4, 20 (2021). https://doi.org/10.1186/s42400-021-00084-8
Received:
Accepted:
Published:
DOI: https://doi.org/10.1186/s42400-021-00084-8